. 2010 Jul 22;116(3):456-65.
doi: 10.1182/blood-2010-01-260372. Epub 2010 Mar 19.

Pain-related behaviors and neurochemical alterations in mice expressing sickle hemoglobin: modulation by cannabinoids

Affiliations

Pain-related behaviors and neurochemical alterations in mice expressing sickle hemoglobin: modulation by cannabinoids

Divyanshoo R Kohli et al. Blood. .

Abstract

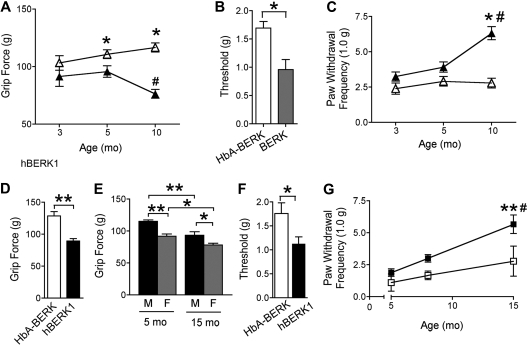
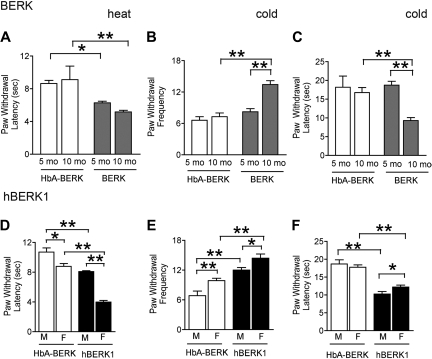
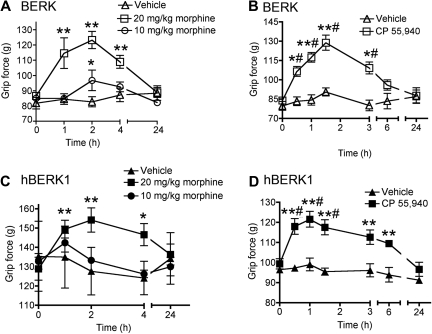
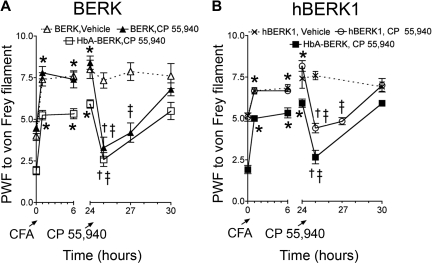
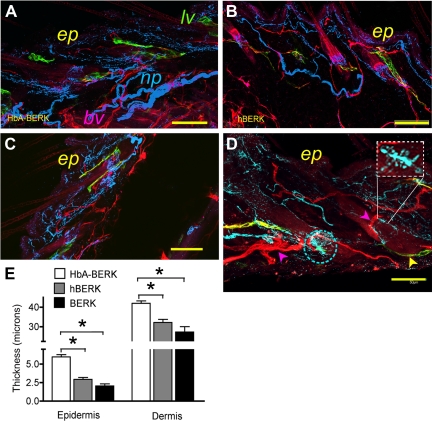
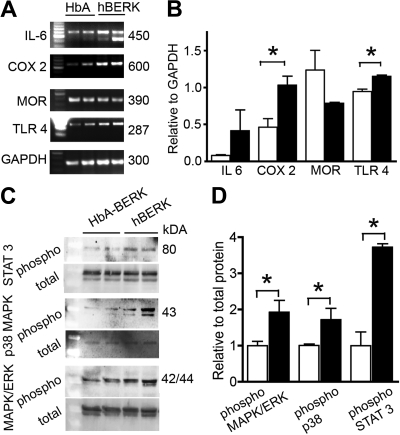
Sickle cell disease causes severe pain. We examined pain-related behaviors, correlative neurochemical changes, and analgesic effects of morphine and cannabinoids in transgenic mice expressing human sickle hemoglobin (HbS). Paw withdrawal threshold and withdrawal latency (to mechanical and thermal stimuli, respectively) and grip force were lower in homozygous and hemizygous Berkley mice (BERK and hBERK1, respectively) compared with control mice expressing human hemoglobin A (HbA-BERK), indicating deep/musculoskeletal and cutaneous hyperalgesia. Peripheral nerves and blood vessels were structurally altered in BERK and hBERK1 skin, with decreased expression of mu opioid receptor and increased calcitonin gene-related peptide and substance P immunoreactivity. Activators of neuropathic and inflammatory pain (p38 mitogen-activated protein kinase, STAT3, and mitogen-activated protein kinase/extracellular signal-regulated kinase) showed increased phosphorylation, with accompanying increase in COX-2, interleukin-6, and Toll-like receptor 4 in the spinal cord of hBERK1 compared with HbA-BERK. These neurochemical changes in the periphery and spinal cord may contribute to hyperalgesia in mice expressing HbS. In BERK and hBERK1, hyperalgesia was markedly attenuated by morphine and cannabinoid receptor agonist CP 55940. We show that mice expressing HbS exhibit characteristics of pain observed in sickle cell disease patients, and neurochemical changes suggestive of nociceptor and glial activation. Importantly, cannabinoids attenuate pain in mice expressing HbS.


Figures

Figure 1
Figure 1
BERK and hBERK1 mice show deep tissue and mechanical hyperalgesia. All data are shown as mean ± SEM from 4 to 6 mice with 3 observations per mouse. Measurements were made on each mouse on 3 consecutive days. (A) Grip force measurements from age-matched BERK (▲) and HbA-BERK (▵) mice. A lower grip force indicates increased deep tissue hyperalgesia. *P < .05 versus age-matched BERK. #P < .01 versus 3-month-old BERK. (B) Paw withdrawal threshold (50%) to von Frey monofilaments in 10-month-old BERK and HbA-BERK mice. *P < .05. (C) PWF with a von Frey monofilament in BERK (▲) and age-matched HbA-BERK (▵). A higher PWF indicates increased nociception. *P < .05 versus age-matched HbA-BERK. #P < .01 versus 3-month-old BERK. (D) Grip force measurements from 12-month-old male hBERK1 mice compared with age- and sex-matched HbA-BERK mice. A lower grip force indicates increased deep tissue hyperalgesia. **P < .01. (E) Effect of age and sex on grip force in hBERK1 mice (M indicates male; F, female). *P < .05, **P < .01 between the indicated conditions. (F) Paw withdrawal threshold (50%) using von Frey monofilaments in 9- to 10-month-old female hBERK1 mice compared with age- and sex-matched HbA-BERK mice. A lower threshold is indicative of increased sensitivity to nociceptive stimuli. *P < .05. (G) PWF with von Frey monofilaments in male hBERK1 mice (■) compared with HbA-BERK mice (□) at different ages. A higher PWF reflects increased nociception. **P < .01, significant differences (15-month vs 5-month hBERK1). #P < .01, significant differences (15-month hBERK1 vs 15-month HbA-BERK).
Figure 2
Figure 2
BERK and hBERK1 mice show increased heat and cold hyperalgesia. PWL after application of a heat stimulus (A,D) and nocifensive behaviors on a cold plate at 4 ± 1°C (B-C,E-F) were recorded for each mouse. Shorter PWL (in seconds) in response to heat stimulus is indicative of increased thermal hyperalgesia. A higher PWF in a 2-minute period and lower PWL on a cold plate are indicative of increased sensitivity to cold-induced nociception. Data are the mean ± SEM from 4 to 6 mice with 3 observations per mouse. Significance of differences between the indicated conditions in each panel: *P < .05, **P < .01. (A) PWL after a heat stimulus in age- and sex-matched BERK and HbA-BERK mice. (B) PWF on a cold plate in age- and sex-matched BERK and HbA-BERK mice. (C) PWL on a cold plate in age- and sex-matched BERK and HbA-BERK mice. (D) PWL after a heat stimulus in 9-month-old hBERK1 and age-matched HbA-BERK mice. (E-F) PWF (E) and PWL (F) on a cold plate in 15-month-old hBERK1 and age-matched HbA-BERK mice. M indicates male; F, female.
Figure 3
Figure 3
Morphine and CP 55940 treatment reduce nociceptive behaviors in BERK and hBERK1 mice. Mice were injected intraperitoneally with morphine or vehicle (A,C) and 0.3 mg/kg CP 55940 or vehicle (B,D), and grip force responses were recorded over the indicated time period. An increase in grip force indicates a decrease in nociception. All data are shown as mean ± SEM from 4 to 6 mice with 3 observations per mouse. Significance of differences: In panel A: *P < .05, **P < .01 versus baseline at 0 hours (immediately before treatment). In panel B: *P < .05, **P < .01 versus baseline; #P < .01 versus vehicle at the same time point. In panel C: *P < .05, **P < .01 versus baseline. In panel D: #P < .01 versus baseline; **P < .01 versus vehicle at the same time point.
Figure 4
Figure 4
Local application of CP 55940 reduces CFA-induced pain in BERK and hBERK1 mice. PWF was assessed by the application of 1.0 g of von Frey filament in 10-month-old BERK (A) and 8-month-old male hBERK1 (B) mice and age- and sex-matched HbA-BERK mice. PWFs were recorded before and for 24 hours after injecting 10 μg (in 10 μL) of CFA. Then, 10 μg (in 10 μL) of CP 55940 or vehicle was injected in the same hind paw, and PWF recorded over another 6 hours. Data are shown as mean ± SEM from 4 mice with 3 observations per mouse. Significance of differences: In panel A: *P < .05, after CFA versus baseline (before CFA); †P < .01, immediately before versus after administration of CP 55940; ‡P < .01, CP 55940 versus vehicle at the same time point. In panel B: *P < .01, after CFA versus baseline (before CFA); †P < .01, CP 55940 versus vehicle at the same time point; ‡P < .01, immediately before versus after administration of CP 55940.
Figure 5
Figure 5
Laser scanning confocal microscopy and immunofluorescent microscopy of skin from male hBERK1 and matched HbA-BERK mice. (A-D) A montage of overlapping fields of Z-stack images (each 2.5-μm-thick) of 80- to 100-μm-thick sections of skin in HbA-BERK (A), hBERK1 (B), and BERK (C-D), showing vascular, lymphatic, and nerve architecture. Image shows CD31+ blood vessels (pseudo-colored red), PGP 9.5 immunoreactive nerves (pseudo-colored blue), and LYVE1+ lymphatic vessels (pseudo-colored green). Bar represents 250 μm (A-C) and 50 μm (D). The rectangular inset in panel D shows an enlargement of sprouting of nerve fibers, also seen in the encircled area. ep indicates epidermis; lv, lymphatic vessels; and np, nerve plexus. Each image represents 3 reproducible and similar images. Image acquisition information: FluoView FV1000 Laser Scanning Confocal BX61 Microscope (Olympus); 20×/0.70 (A-C), 40×/1.35 (D) oil objective lenses; In-built image acquisition system; Adobe Photoshop. (E) Morphometric analysis of epidermal and dermal thickness performed on hematoxylin and eosin-stained skin sections (shown in supplemental Figure 3; original magnification ×200) by substituting 1 unit for 0.5 μm as per the calibration of the micrometer. Data are shown as mean ± SEM of 9 measurements of 3 separate sections from 3 different mice. □ represents HbA-BERK mice; formula image, hBERK1 mice; and ■, BERK mice. *P < .01.
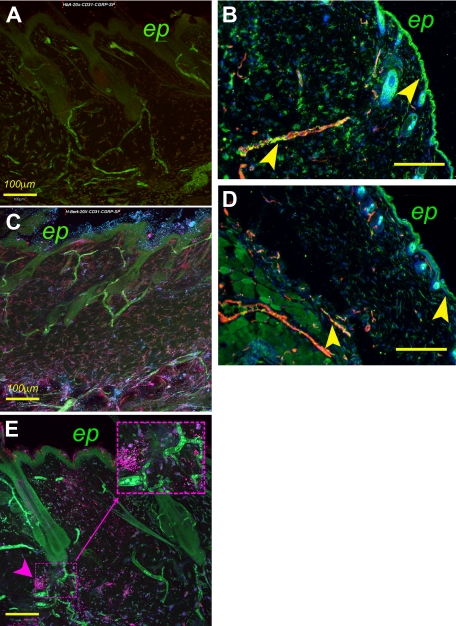
Figure 6
Figure 6
A montage of overlapping fields of z-stack images (each 2.5-μm-thick) of 80- to 100-μm-thick sections of skin showing the expression of mediators of pain in skin. HbA-BERK (A), hBERK1 (C), and BERK (E). Image shows CD31+ blood vessels (pseudo-colored green), SP immunoreactivity (pseudo-colored red), and CGRP immunoreactivity (pseudo-colored blue). Magenta color in panels C and E is indicative of colocalization of CGRP (blue) and SP (red). The inset in panel E shows localized, dense immunoreactivity for SP in BERK mice. Bar represents 100 μm. ep indicates epidermis. (B,D) Coexpression of MOR and CD31+ on blood vessels in HbA-BERK (B) and hBERK1 (D) mice. Image shows CD31+ blood vessels (pseudo-colored red), MOR immunoreactivity (pseudo-colored green), and 4,6-diamidino-2-phenylindole+ nuclei (pseudo-colored blue). Yellow represents coexpression of MOR on blood vessels. Original magnification ×150; scale bar represents 250 μm. Arrows indicate MOR expression in the epidermis and vasculature. ep indicates epidermis. Each figure is representative of images from skins of 3 different mice. Image acquisition information: FluoView FV1000 Laser Scanning Confocal BX61 Microscope (Olympus), 20×/0.70 oil objective lens, In-built image acquisition system, Adobe Photoshop (panels A,C,E); Olympus IX70 microscope, 15×/0.45 objective lens, DP70 digital camera and DP70 Manager software (Olympus), Adobe Photoshop (panels B,D).
Figure 7
Figure 7
Expression of inflammatory and neurochemical mediators in the spinal cords of male hBERK1 mice. (A-B) mRNA expression using semiquantitative reverse-transcribed polymerase chain reaction. GAPDH expression shows the loading control. The first lane indicates size markers. (B) Bar represents band density for each product relative to band density of GAPDH. (C-D) Expression of phosphorylated and total proteins (MAPK/ERK, p38 MAPK, and STAT3) determined using Western immunoblotting. Bar represents band density of individual phosphoprotein relative to its total protein. (B,D) Data are the mean ± SEM of 4 separate experiments. ■ represents hBERK1 mice; □, HbA-BERK mice. *P < .05.

Comment in

Similar articles

Cited by

References

    1. Ballas SK. Progress in Pain Research and Management. vol 11. Seattle WA: IASP Press; 1998.
    1. Smith WR, Penberthy LT, Bovbjerg VE, et al. Daily assessment of pain in adults with sickle cell disease. Ann Intern Med. 2008;148(2):94–101. - PubMed
    1. Ballas SK. Current issues in sickle cell pain and its management. Hematology Am Soc Hematol Educ Program. 2007:97–105. - PubMed
    1. Dampier CD, Setty BN, Logan J, Ioli JG, Dean R. Intravenous morphine pharmacokinetics in pediatric patients with sickle cell disease. J Pediatr. 1995;126(3):461–467. - PubMed
    1. Darbari DS, Minniti CP, Rana S, van den Anker J. Pharmacogenetics of morphine: potential implications in sickle cell disease. Am J Hematol. 2008;83(3):233–236. - PubMed

Publication types

MeSH terms