Comparative Study
. 2010 Apr 15;184(8):4295-306.
doi: 10.4049/jimmunol.0903418. Epub 2010 Mar 19.

Role of SMAD and non-SMAD signals in the development of Th17 and regulatory T cells

Affiliations
Comparative Study

Role of SMAD and non-SMAD signals in the development of Th17 and regulatory T cells

Ling Lu et al. J Immunol. .

Abstract

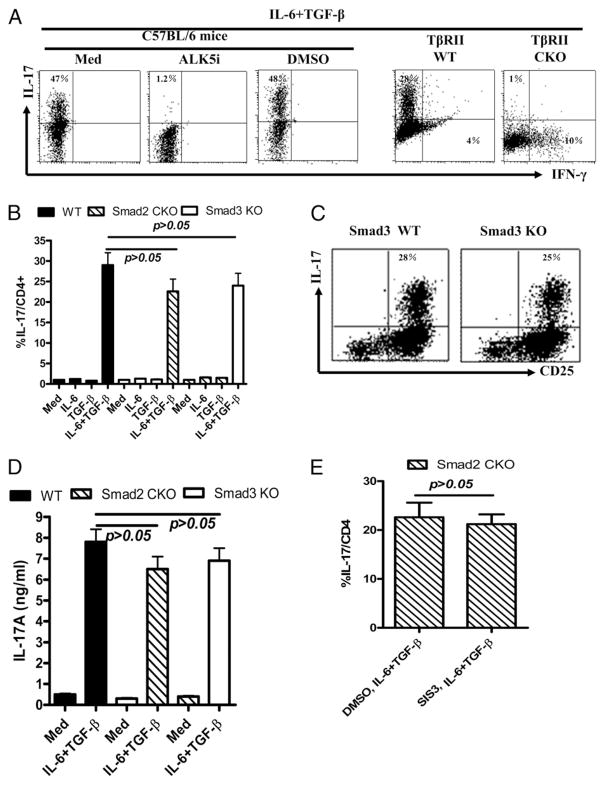
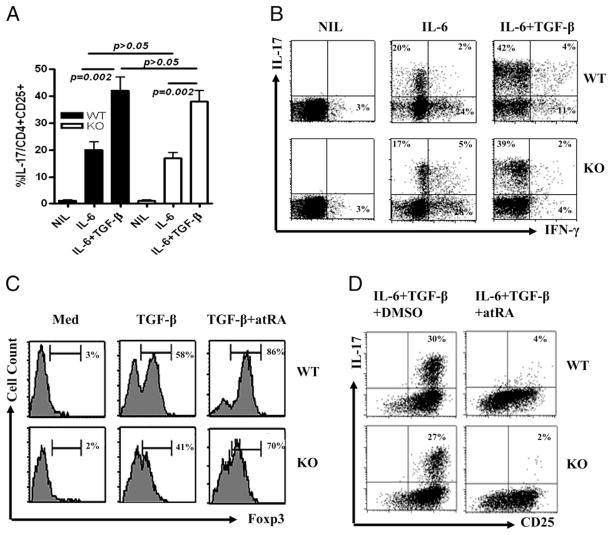
Whereas TGF-beta is essential for the development of peripherally induced Foxp3(+) regulatory T cells (iTreg cells) and Th17 cells, the intracellular signaling mechanism by which TGF-beta regulates development of both cell subsets is less understood. In this study, we report that neither Smad2 nor Smad3 gene deficiency abrogates TGF-beta-dependent iTreg induction by a deacetylase inhibitor trichostatin A in vivo, although the loss of the Smad2 or Smad3 gene partially reduces iTreg induction in vitro. Similarly, SMAD2 and SMAD3 have a redundant role in development of Th17 in vitro and in experimental autoimmune encephalomyelitis. In addition, ERK and/or JNK pathways were shown to be involved in regulating iTreg cells, whereas the p38 pathway predominately modulated Th17 and experimental autoimmune encephalomyelitis induction. Therefore, selective targeting of these intracellular TGF-beta signaling pathways during iTreg and Th17 cell development might lead to the development of therapies in treating autoimmune and other chronic inflammatory diseases.


Conflict of interest statement

Disclosures

The authors have no financial conflicts of interest.

Figures

FIGURE 1
FIGURE 1
Distinct role of TGF-β and SMAD signals in the induction of Foxp3+ regulatory T cells in vitro. Naive CD4+ cells isolated from WT, TβR-II CKO, Smad2 CKO and Smad3 KO mice were cultured with anti-CD3/CD28–coated beads (1 bead to 5 cells) and IL-2 (20 U/ml) in the absence (CD4Med) or presence of 2 ng/ml TGF-β (CD4TGF-β) for 4 d. ALK5 inhibitor (5 μM) or DMSO was added to some cultures. Foxp3 expression and suppressive activities of these cells were analyzed by FACS. A, Percentages of Foxp3 expression by CD4+ cells from wide type mice treated with ALK5 inhibitor or control DMSO or from TβR-II CKO mice. Values are mean ±SEM of three independent experiments (left panel) and a representative of dot plot flow data (right panel). B, The suppressive activity of CD4Med and CD4TGF-β cells generated as in A. These conditioned cells with a ratio of 1:4 (one conditioned cell to four responder cells, Tcon/Tresp = 1:4) were added to CFSE-labeled T responder cells isolated from WT mice and cocultured with anti-CD3 (0.025 μg/ml) in the presence of APCs from WT mice for 3 d. Histogram data are gated on CD4+ cells of T responder cells. Data are the representative of three similar experiments. C, Expression of Foxp3 protein (left panel) and mRNA (right panel) by TGF-β–primed or control CD4+CD25+ cells in WT, Smad2 CKO, and Smad3 KO mice. Experiments were conducted similarly as in A, and the percentages of cells expressing Foxp3 among CD4+CD25+ cells were analyzed by FACS (left panel). Values are mean ± SEM of three independent experiments. Foxp3 mRNA between various groups of CD4+CD25+ cells was determined by quantitative RT-PCR (right panel). Values are mean ± SEM of triplicate samples of one experiment. Similar results were obtained in a second experiment. D and E, The percentage of suppressive activities of CD4 conditioned (CD4Med and CD4TGF-β) cells generated from WT, Smad2 CKO, and Smad3 KO mice was calculated as (A − B)/A × 100%, where A is the number of responder CD4+ T cells cycling at baseline, and B is the number of responder CD4+ T cells cycling at cocultures with CD4+ conditioned cells (Tcon/Tresp = 1:4). Experiments were conducted similarly as in B. F, Naive CD4+ cells were pretreated with or without SIS3 (3–10 μM) for 1 h and then stimulated with or without TGF-β (2 ng/ml) for 24 h. SMAD3 and p-SMAD3 expression was analyzed by Weston blotting. G, Naive CD4+ cells isolated from Smad2 CKO were stimulated as in A with or without SIS3 (10 μM) for 4 d. Foxp3 expression of by TGF-β–primed CD4+ cells was analyzed by FACS. The differences were analyzed using Student t test; p < 0.05 was considered significant.
FIGURE 2
FIGURE 2
The role of SMAD signals in the induction of Foxp3+ regulatory T cells in vivo. A, Doxycycline-induced TβRII KO, as described in Materials and Methods, and WT mice were given DMSO or TsA (1 mg/kg/d, i.p., for 7 d) and CD4+Foxp3+ cell frequency in spleens was analyzed by FACS. B, Foxp3 GFP knock-in mice were treated with DMSO or TsA as in A with or without i.p. treatment with ALK5 inhibitor (1 mg/kg/d, every other day). Foxp3+ (GFP+) cell numbers in spleens were analyzed by FACS at 7 d after treatment. Values are mean ± SEM of three mice each group. Experiments were repeated with similar results. C, TsA but not DMSO treatment induces CD103 expression in Foxp3+ cells. D, WT, Smad2 CKO, and Smad3 KO mice were treated with DMSO or TsA as in A, and CD4+Foxp3+ cell frequency in spleens in each group was analyzed by FACS. Data indicate mean ± SEM of five mice each group (D) and representative of these experiments with dot plot flow data (E). The differences were analyzed by Student t test; p < 0.05 was considered significantly different.
FIGURE 3
FIGURE 3
TGF-β but not SMAD2 or SMAD3 plays a crucial role in the induction of Th17 cells invitro. Naive CD4+ T cells isolated from WT, TβRII CKO, Smad2 CKO, and Smad3 KO mice were stimulated with soluble anti-CD3 (1 μg/ml) and anti-CD28 (10 μg/ml) in the presence of TGF-β (2 ng/ml), IL-6 (10 ng/ml), anti–IL-4 (10 μg/ml), and anti–IFN-γ (10 μg/ml) for 3 d. ALK5 inhibitor (5 μM) was added to some cultures. Supernatants were harvested for measuring soluble IL-17. A, Naive CD4+ cells isolated from WT and TβRII CKO mice were stimulated with anti-CD3 and anti-CD28 in the presence of TGF-β and IL-6 as above for 3 d. ALK5 inhibitor or DMSO vehicle control was added to CD4+ cells from WT mice. Intracellular IL-17 and IFN-γ expression by CD4+ cells was analyzed by FACS. Data are representative of three separate experiments. Th17 cell differentiation in WT, Smad2 CKO, or Smad3 KO mice values indicate mean ± SEM of three separate experiments (B) and the representative of Th17 cell differentiation in WT and Smad3 KO mice from these experiments (C). D, IL-17 levels were assayed with an ELISA using supernatants from stimulated naive CD4+ cells from various mice as indicated in B. E, Naive CD4+ cells isolated from Smad2 CKO mice were pretreated with SIS3 (10 μM) for 1 h and then stimulated under Th17 conditions as described above. Intracellular IL-17 was analyzed by FACS. Values indicate mean ± SEM of three separate experiments. The differences were analyzed by Student t test; p < 0.05 was considered significantly different.
FIGURE 4
FIGURE 4
The absence of Smad3 gene does not alter IL-17 production in vivo, nor does it affect the development of Th17-mediated disease. A, WT and Smad3 KO mice were immunized with MOG35–55 to induce EAE. Disease severities were scored as described in Materials and Methods. (EAE scores are similar in two groups.) The figure is representative of two similar experiments (n = 4 mice per group). B, IL-17 and IFN-γ production by CD4+ cells in draining lymph nodes, spleens, and blood in WT and Smad3 KO mice at day 18 after immunization with MOG35–55. Values indicate mean ± SEM of four mice (B). The differences were analyzed by Student t test; p < 0.05 was considered significantly different. C, Representative cytokine expression data from B.
FIGURE 5
FIGURE 5
The SMAD3-independent effect of atRA on promoting Foxp3+ Treg cells and suppressing Th17 cells. A, Splenic CD4+CD25+CD62L+ cells sorted from WT and Smad3 KO mice (purity of both cell populations expressed >99% of CD25 and CD62L) were stimulated with immobilized anti-CD3 and soluble anti-CD28 for 3 d with anti–IL-4 and anti–IFN-γ with or without IL-6 and/or TGF-β. IL-17+ cell conversion from nTreg cells was determined by FACS. Values indicate mean ± SEM of three separate experiments. The differences were analyzed by Student t test; p < 0.05 was considered significantly different. B, Representative intracellular cytokine data from A. Naive CD4+ cells from WT and Smad3 KO mice were cultured under a condition polarizing toward iTreg cells (C) or (D) Th17 cells. Where indicated, atRA was used at 10 nM. Foxp3 expression is gated on CD4+ cells in C, and IL-17 expression is gated on activated CD4+ cells in D. FACS analysis was performed after 4 d of culture. C and D are representative of five separate experiments.
FIGURE 6
FIGURE 6
Role of MAPKs in the differentiation of Foxp3+ Treg and Th17 cells. A, Splenic CD4+ CD62L+ cells isolated from C57BL/6 mice were activated with anti-CD3/CD28 Abs with or without TGF-β for 24 h. ERK and JNK activation was measured using Western blotting. Experiments were repeated three times with similar results. B, iTreg cells were induced from WT and Smad3 KO mice as in Fig. 1A. MAPK inhibitors (P38i and JNKi, 10 μM; ERKi, 50 μM) were added to cultures, and Foxp3 expression was determined by FACS. Values indicate mean ± SEM of four independent experiments. C, Foxp3 induction in CD4+ cells from WT, ERK1 KO, and JNK2 KO mice. Results were representative of three similar experiments. D–F, Th17 cell differentiation in CD4+ cells from WT, Smad3 KO, ERK1 KO, and JNK2 KO mice. MAPK inhibitors were added to cultures every 24 h for 3 d in some cultures. D, Percentages of CD4+CD25+ cells expressing IL-17. Values indicate mean ± SEM of five independent experiments. E, Flow cytometric data representative of the five separate experiments depicted as histograms in D. F, Th17 cell differentiation in CD4+ cells from WT, ERK1 KO and JNK2 KO mice. Values are mean ± SEM of three independent experiments. G, The addition of MAPK inhibitors does not affect CD4+ cell proliferation; 2 × 10⁵ naive CD4+ cells were cultured under a condition polarizing toward Th17 cells with DMSO or MAPK inhibitors with similar concentrations as in B for 3 d. [3H]Thymidine incorporation was measured by liquid scintillation. All differences were analyzed by Student t test; p < 0.05 was considered significantly different.
FIGURE 7
FIGURE 7
Injection of p38 inhibitor markedly alleviates EAE and downregulates Th17 cell production. A, WT mice were immunized with MOG35–55 (100 μg per mouse), followed by the administration of pertussis toxin (150 ng per mouse; Sigma-Aldrich) on days 0 and 2. The p38 inhibitor (SB203580) was injected i.p. into WT mice 2 d after immunization with MOG35–55 peptide, and injection was repeated every other day for 7 d. Mice that received 2% DMSO solution only were used as controls. Disease severities were scored with a standard as described in Materials and Methods. The differences between two groups in time points indicated were statistically analyzed using GraphPad Prism 4 (GraphPad, La Jolla, CA. *p < 0.05; **p < 0.01; ***p < 0.001. The figure shows one representative of two similar experiments (n = 5 mice per group). B, IL-17 production in CD4+ cells in draining lymph nodes, spleens, and blood in two groups of mice at day 18 after immunization with MOG35–55. Values indicate mean ± SEM of five mice in each group. The differences were analyzed by the Student t test; p < 0.05 was considered as significantly different. C, Representative cytometric data of IL-17 and IFN-γ production by CD4+ cells in lymph nodes from EAE mice (n = 5) treated with or without p38 inhibitor.
FIGURE 8
FIGURE 8
Schematic model for the role of TGF-β signaling pathways in iTreg and Th17 cell development. TGF-β binding induces heteromeric complex formation of TβR-II and TβR-I. This complex activates SMAD2 or SMAD3, as well as the ERK and JNK MAPKs pathways, which induces Foxp3 expression and drives the development of induced regulatory T cells when IL-2 is present. Conversely, this complex activates STAT3, JNK, and p38 MAPKs, promoting RORγt-expressing CD4+ cells to differentiate into Th17 cells when IL-6 is present. Foxp3 expression can suppress RORγt+ cells from conversion to Th17 cells, but IL-6 signaling pathway molecules, such as STAT3 and SMAD7, also have a negative feedback on Foxp3+ induced regulation differentiation.

Similar articles

Cited by

References

    1. Zheng SG, Wang J, Wang P, Gray JD, Horwitz DA. IL-2 is essential for TGF-beta to convert naive CD4+CD25− cells to CD25+Foxp3+ regulatory T cells and for expansion of these cells. J Immunol. 2007;178:2018–2027. - PubMed
    1. Davidson TS, DiPaolo RJ, Andersson J, Shevach EM. Cutting Edge: IL-2 is essential for TGF-beta-mediated induction of Foxp3+ T regulatory cells. J Immunol. 2007;178:4022–4026. - PubMed
    1. Veldhoen M, Hocking RJ, Atkins CJ, Locksley RM, Stockinger B. TGFbeta in the context of an inflammatory cytokine milieu supports de novo differentiation of IL-17-producing T cells. Immunity. 2006;24:179–189. - PubMed
    1. Bettelli E, Carrier Y, Gao W, Korn T, Strom TB, Oukka M, Weiner HL, Kuchroo VK. Reciprocal developmental pathways for the generation of pathogenic effector TH17 and regulatory T cells. Nature. 2006;441:235–238. - PubMed
    1. Mangan PR, Harrington LE, O’Quinn DB, Helms WS, Bullard DC, Elson CO, Hatton RD, Wahl SM, Schoeb TR, Weaver CT. Transforming growth factor-beta induces development of the T(H)17 lineage. Nature. 2006;441:231–234. - PubMed

Publication types

MeSH terms