

Metabolic and transcriptional responses of glycerolipid pathways to a perturbation of glycerol 3-phosphate metabolism in Arabidopsis
- PMID: 20304913
- PMCID: PMC2906289
- DOI: 10.1074/jbc.M109.097758
Metabolic and transcriptional responses of glycerolipid pathways to a perturbation of glycerol 3-phosphate metabolism in Arabidopsis
Abstract
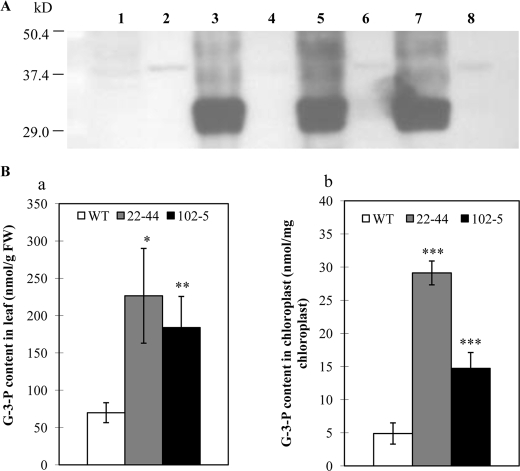
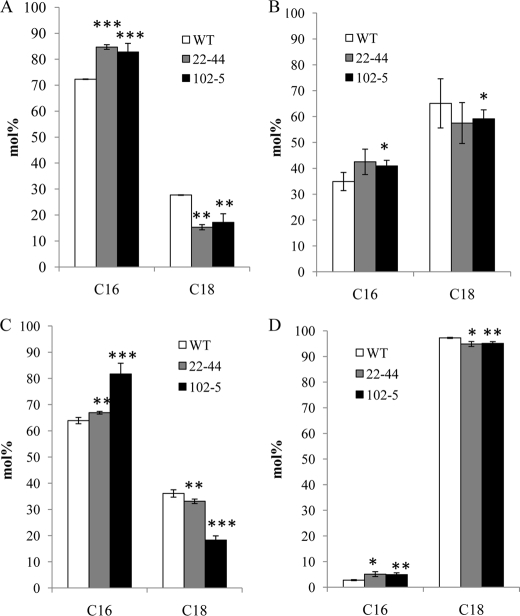
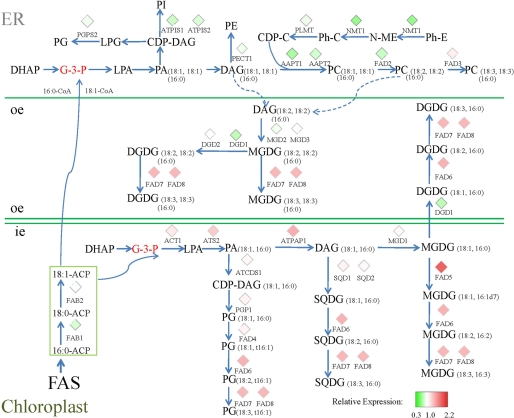
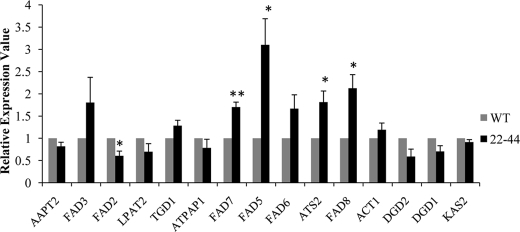
Glycerolipid synthesis in plants involves two major metabolic pathways compartmentalized in the chloroplasts and cytosol, respectively. Although these two parallel pathways are regulated with considerable flexibility, the factors mediating this process remain unclear. To investigate the influence of glycerol 3-phosphate (Gly-3-P) on the interactions of the glycerolipid pathways, we generated transgenic Arabidopsis lines with a feedback-resistant Gly-3-P dehydrogenase gene (gpsA(FR)) from Escherichia coli. gpsA(FR) was detected in the cytosol, but augmented Gly-3-P levels were observed in the cytosol as well as in chloroplasts. Glycerolipid composition and fatty acid positional distribution analyses revealed an altered fatty acid flux that affected not only the molar ratios of glycerolipid species but also their fatty acid composition. To decipher this complex pathway, a transgenic line was subjected to lipidomic analysis and a global gene-expression survey. The results revealed that changes in Gly-3-P metabolism caused altered expression of a broad array of genes. When viewed from the perspective of glycerolipid metabolism, coherent networks emerged, revealing that many enzymatic components of the glycerolipid pathways operate in a modular manner under the influence of Gly-3-P. Transcript levels of the enzymes involved in the prokaryotic pathway were mostly induced, whereas genes of the eukaryotic pathway enzymes were largely suppressed. Hence, the gene-expression changes were consistent with the detected biochemical phenotype. Our results suggest that Gly-3-P modulates the balance of the two glycerolipid pathways in Arabidopsis by influencing both metabolic flux and gene transcription.
Figures
Similar articles
-
Over-expression of Arabidopsis thaliana SFD1/GLY1, the gene encoding plastid localized glycerol-3-phosphate dehydrogenase, increases plastidic lipid content in transgenic rice plants.J Plant Res. 2016 Mar;129(2):285-293. doi: 10.1007/s10265-015-0781-0. Epub 2016 Jan 8. J Plant Res. 2016. PMID: 26747130 Free PMC article.
-
The Arabidopsis thaliana dihydroxyacetone phosphate reductase gene SUPPRESSSOR OF FATTY ACID DESATURASE DEFICIENCY1 is required for glycerolipid metabolism and for the activation of systemic acquired resistance.Plant Cell. 2004 Feb;16(2):465-77. doi: 10.1105/tpc.016907. Epub 2004 Jan 16. Plant Cell. 2004. PMID: 14729910 Free PMC article.
-
Identification of a mitochondrial glycerol-3-phosphate dehydrogenase from Arabidopsis thaliana: evidence for a mitochondrial glycerol-3-phosphate shuttle in plants.FEBS Lett. 2003 Feb 11;536(1-3):92-6. doi: 10.1016/s0014-5793(03)00033-4. FEBS Lett. 2003. PMID: 12586344
-
Lipid turnover during senescence.Plant Sci. 2013 May;205-206:13-9. doi: 10.1016/j.plantsci.2013.01.004. Epub 2013 Jan 26. Plant Sci. 2013. PMID: 23498858 Review.
-
Compartmentation in plant metabolism.J Exp Bot. 2007;58(1):35-47. doi: 10.1093/jxb/erl134. Epub 2006 Oct 9. J Exp Bot. 2007. PMID: 17030538 Review.
Cited by
-
Biochemical and Transcriptional Regulation of Membrane Lipid Metabolism in Maize Leaves under Low Temperature.Front Plant Sci. 2017 Nov 30;8:2053. doi: 10.3389/fpls.2017.02053. eCollection 2017. Front Plant Sci. 2017. PMID: 29250095 Free PMC article.
-
Two Glycerol-3-Phosphate Dehydrogenases from Chlamydomonas Have Distinct Roles in Lipid Metabolism.Plant Physiol. 2017 Aug;174(4):2083-2097. doi: 10.1104/pp.17.00491. Epub 2017 Jun 6. Plant Physiol. 2017. PMID: 28588114 Free PMC article.
-
In silico metabolic network analysis of Arabidopsis leaves.BMC Syst Biol. 2016 Oct 29;10(1):102. doi: 10.1186/s12918-016-0347-3. BMC Syst Biol. 2016. PMID: 27793154 Free PMC article.
-
Comparative transcriptome analyses of oleaginous Botryococcus braunii race A reveal significant differences in gene expression upon cobalt enrichment.Biotechnol Biofuels. 2018 Dec 18;11:333. doi: 10.1186/s13068-018-1331-5. eCollection 2018. Biotechnol Biofuels. 2018. PMID: 30568733 Free PMC article.
-
Glycerol affects root development through regulation of multiple pathways in Arabidopsis.PLoS One. 2014 Jan 22;9(1):e86269. doi: 10.1371/journal.pone.0086269. eCollection 2014. PLoS One. 2014. PMID: 24465999 Free PMC article.
References
-
- Roughan P. G., Slack C. R. (1982) Annu. Rev. Plant. Physiol. 33, 97–132
-
- Frentzen M., Heinz E., McKeon T. A., Stumpf P. K. (1983) Eur. J. Biochem. 129, 629–636 - PubMed
-
- Heinz E. (1977) in Lipids and Lipid Polymers in Higher Plants (Telvini M., Lichtentaler H. K. eds) pp. 102–120, Springer-Verlag, Berlin
Publication types
MeSH terms
Substances
LinkOut - more resources
Full Text Sources
