. 2010 Jun 18;285(25):19193-204.
doi: 10.1074/jbc.M110.113613. Epub 2010 Mar 19.

Distribution and function of macrophage galactose-type C-type lectin 2 (MGL2/CD301b): efficient uptake and presentation of glycosylated antigens by dendritic cells

Affiliations

Distribution and function of macrophage galactose-type C-type lectin 2 (MGL2/CD301b): efficient uptake and presentation of glycosylated antigens by dendritic cells

Kaori Denda-Nagai et al. J Biol Chem. .

Abstract

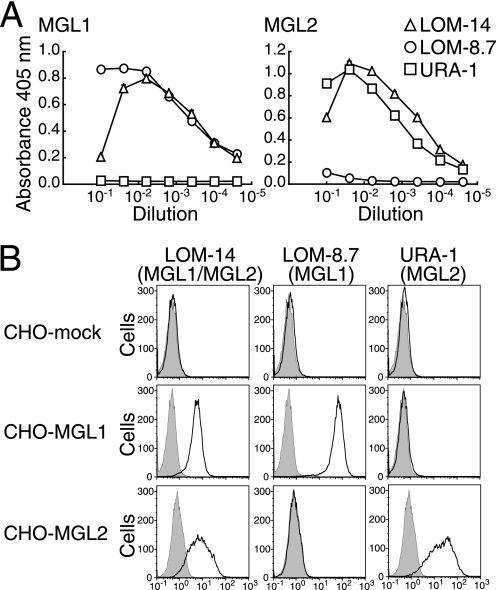
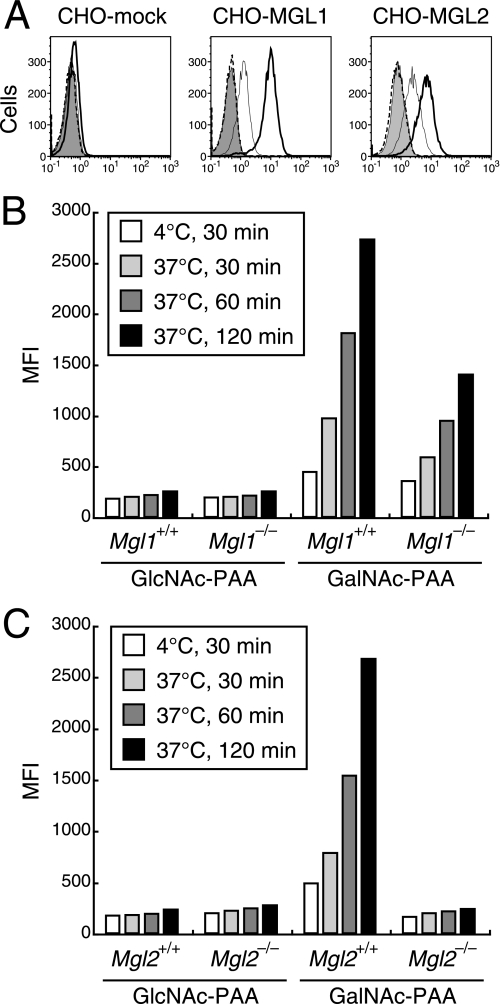
Dendritic cells (DCs) express cell surface lectins that are potentially involved in the recognition, uptake, and presentation of glycosylated foreign substances. A unique calcium-type (C-type) lectin, the macrophage galactose (Gal)-type C-type lectin (MGL/CD301) expressed on DCs, is thought to participate in the recognition of molecules from both altered self and pathogens due to its monosaccharide specificity for Gal and N-acetylgalactosamine (GalNAc). Although mice have two MGL genes, Mgl1 and Mgl2, their distinct roles have not been previously explored. The present report characterizes the properties of MGL2 by examining its distribution and its role in antigen presentation by DCs. We generated an MGL2-specific monoclonal antibody and examined MGL2 expression in tissues by immunohistochemistry and in isolated cells by flow cytometry. The cells reactive with this antibody were shown to be a portion of MGL1-expressing cells, mostly conventional DCs. Internalization of soluble polyacrylamide polymers (PAA) with alpha-GalNAc residues (GalNAc-PAA) by bone marrow-derived DCs (BM-DCs) was mediated by MGL2, as revealed by a comparison of Mgl1(-/-) and Mgl2(-/-) BM-DCs with wild-type BM-DCs. Biotinylated GalNAc-PAA conjugated to streptavidin (SAv) was more efficiently presented to SAv-primed T cells by BM-DCs than beta-N-acetylglucosamine-PAA conjugated to SAv or SAv alone as shown by thymidine uptake and cytokine production. This is the first report that demonstrates the involvement of GalNAc residues in antigen uptake and presentation by DCs that lead to CD4(+) T cell activation.


Figures

FIGURE 1.
FIGURE 1.
Specificity of mAb URA-1 for MGL2 compared with mAb LOM-14 and mAb LOM-8.7. A, binding of mAb LOM-14 (anti-MGL1/MGL2, open triangle), mAb LOM-8.7 (anti-MGL1, open circle), and mAb URA-1 (anti-MGL2, open square) to MGL1-ECD or MGL2-ECD in the enzyme-linked immunosorbent assay is shown. Hybridoma culture supernatants were serially diluted as indicated. Data are shown as the mean ± S.D. of triplicates. B, binding profiles of the same mAbs to CHO cells transfected with Mgl1 or Mgl2 cDNA using flow cytometric analysis are shown. The binding profiles of control rat IgG are shown by gray-filled lines. The binding profiles of these three mAbs indicated above are shown by black lines.
FIGURE 2.
FIGURE 2.
Immunohistochemical localizations of binding sites for mAb LOM-8.7 and mAb URA-1 in various tissues. A, Thymus. B, spleen. C, Lung. The distribution of cells stained with these antibodies indicated by arrowheads was limited within connective tissues in these organs. The apparent relative incidence of mAb LOM-8.7- and mAb URA-1-positive cells was similar in thymi. The apparent relative incidence was greater with mAb LOM-8.7 than with mAb URA-1 in spleens, whereas it was slightly greater with mAb URA-1 than with mAb LOM-8.7 in lungs. Scale bars represent 50 μm for A and C and 100 μm for B.
FIGURE 3.
FIGURE 3.
Expression of MGL1 and MGL2 on cells from BM, spleens, and lungs analyzed by flow cytometry. A, staining profiles of anti-CD11c and bio-LOM-8.7 followed by PE-Cy7-SAv are shown. B, staining profiles of anti-CD11c and APC-URA-1 are shown. C, staining profiles of bio-LOM-8.7 followed by PE-Cy7-SAv and APC-URA-1 are shown. In panels D–F, MGL1 and MGL2 double-positive cells and MGL1 single-positive cells gated in C were further analyzed for the expression of CD11c and other surface markers: D, cells from BM; E, cells from spleens; F, cells from lungs. In all panels cells were analyzed after excluding dead cells and CD3+ or CD19+ cells. The data are representative of three or more independent experiments.
FIGURE 4.
FIGURE 4.
Expression of MGL1 and MGL2 on surface of macrophages analyzed by flow cytometry. A, BM-macrophages. B, PEC-macrophages. C, PEC-macrophages cultured overnight in the presence or absence of indicated cytokines. In all panels, the profiles obtained with isotype controls are shown as gray-filled lines, and the profiles with mAbs LOM-8.7 and URA-1 are shown as black lines. Geometric MFI for the mAb binding and isotype control are shown in each panel and at the right of each panel, respectively.
FIGURE 5.
FIGURE 5.
Expression of MGL1 and MGL2 on surface of CD11c+ BM-DCs. A, BM-DCs were prepared from BM cells of WT littermate of Mgl1−/− mice (Mgl1+/+). B, BM-DCs were prepared from BM cells of Mgl1−/− mice. C, BM-DCs were prepared from BM cells of WT littermate of Mgl2−/− mice (Mgl2+/+). D, BM-DCs were prepared from BM cells of Mgl2−/− mice. In all panels CD11c+ cells were obtained by MACS, and bindings of mAbs LOM-8.7 and URA-1 were determined by flow cytometry. The data are representative of three or more independent experiments. E, MGL2 expression profiles of Mgl1+/+ BM-DCs (black line derived from the right panel in A) and Mgl1−/− BM-DCs (gray-filled line derived from the right panel in B) are shown as overlaid histograms. F, MGL1 expression profiles of Mgl2+/+ BM-DCs (black line derived from the middle panel in C) and Mgl2−/− BM-DCs (gray-filled line derived from the middle panel in D) are shown as overlaid histograms. In panels E and F, MFI for the mAb binding is shown under each panel.
FIGURE 6.
FIGURE 6.
Binding and uptake of GalNAc-PAA by CHO cells transfected with Mgl1 or Mgl2 cDNA and by CD11c+ BM-DCs. A, flow cytometric profiles of CHO transfectants with FITC-PAA are shown. The cells were incubated with FITC-GlcNAc-PAA (dotted lines) or FITC-GalNAc-PAA (thin lines) on ice for 30 min to estimate the amount bound to cell surfaces. The relative amounts of FITC-GalNAc-PAA internalized by the cells were estimated as follows. The cells were incubated with FITC-GalNAc-PAA at 37 °C for 30 min, treated with EDTA to remove cell surface-associated FITC-GalNAc-PAA, and then analyzed (bold lines). The cells incubated with FITC-GalNAc-PAA on ice for 30 min and then treated with EDTA were also analyzed as a control (gray-filled). B, BM-DCs were prepared from BM cells of Mgl1−/− or WT littermate (Mgl1+/+) mice. C, BM-DCs were prepared from BM cells of Mgl2−/− or WT littermate (Mgl2+/+) mice. In panels B and C, CD11c+ cells were obtained by MACS. Binding and uptake of FITC-PAA were examined using flow cytometry by the same methods as in A. Differences in the geometric MFI of FITC after uptake at 37 °C and binding on ice are shown. In all panels the data are representative of three independent experiments.
FIGURE 7.
FIGURE 7.
T cell activation through antigen presentation by BM-DCs pulsed with bio-GalNAc-PAA conjugated to SAv. A, SAv-primed T cells were co-cultured with immature BM-DCs pulsed with bio-GalNAc-PAA conjugated to SAv (GalNAc-SAv, closed circle), bio-GlcNAc-PAA conjugated to SAv (GlcNAc-SAv, closed triangle), SAv (open square), or no antigen (open circle). The DC to T cell ratio was 4:1. T cell proliferation was measured by [3H]thymidine uptake. Data are shown as the mean cpm ± S.D. of triplicate cultures. **, p < 0.01 and ***, p < 0.001 for GalNAc-SAv compared with GlcNAc-SAv at different SAv concentrations. B, production of cytokines was measured with culture supernatants of SAv-primed T cells co-cultured with CD11c+ BM-DCs. IFN-γ and IL-17A were detected and quantified. BM-DCs were pulsed with GalNAc-SAv (black bar), GlcNAc-SAv (dark gray bar), or no antigen (open bar). The DC to T cell ratio was 10:1. Data are shown as the mean concentration (pg/ml) ± S.D. of triplicate cultures. *, p < 0.05 and ***, p < 0.001 for GalNAc-SAv compared with GlcNAc-SAv. C, SAv-primed T cells were co-cultured with immature BM-DCs pulsed with bio-14Tn-MUC1 and SAv (14Tn-MUC1-SAv, closed diamond), bio-9Tn-MUC1 and SAv (9Tn-MUC1-SAv, closed circle), bio-MUC1 and SAv (MUC1-SAv, closed triangle), SAv (open square), or no antigen (open circle). The DC to T cell ratio was 4:1. T cell proliferation was measured by [3H]thymidine uptake, and the data are shown as the mean cpm ± S.D. of triplicate cultures. **, p < 0.01 and ***, p < 0.001 for 14Tn-MUC1-SAv or 9Tn-MUC1-SAv compared with MUC1-SAv, respectively. D, nylon wool (NW)-purified, CD4+, and CD8+ T cells obtained from SAv-immunized mice were compared for their proliferation response to GalNAc-PAA-mediated antigen presentation by co-culturing them with CD11C+ BM-DCs pulsed with GalNAc-SAv (black bar), GlcNAc-SAv (dark gray bar), SAv (light gray bar), or no antigen (open bar). The DC to T cell ratio was 4:1. T cell proliferation was measured by [3H]thymidine uptake, and the data are shown as the mean cpm ± S.D. of triplicate cultures. **, p < 0.01 and ***, p < 0.001 and not significant (n.s.) for GalNAc-SAv compared with no antigen, GlcNAc-SAv, or SAv. E, SAv-primed T cells were co-cultured with CD11c+ BM-DCs from Mgl1−/− or WT littermate (Mgl1+/+) mice. F, SAv-primed T cells were co-cultured with CD11c+ BM-DCs from Mgl2−/− or WT littermate (Mgl2+/+) mice. In panels E and F, CD11c+ BM-DCs were pulsed with GalNAc-SAv (black bar), GlcNAc-SAv (dark gray bar), SAv (light gray bar), or no antigen (open bar). The DC to T cell ratio was 75:1. T cell proliferation was measured by [3H]thymidine uptake, and the data are shown as the mean cpm ± S.D. of triplicate cultures. *, p < 0.05, **, p < 0.01, ***, p < 0.001, and for GalNAc-SAv compared with no antigen, GlcNAc-SAv, or SAv.

Similar articles

Cited by

References

    1. Apweiler R., Hermjakob H., Sharon N. (1999) Biochim. Biophys. Acta 1473, 4–8 - PubMed
    1. Banchereau J., Steinman R. M. (1998) Nature 392, 245–252 - PubMed
    1. Cambi A., Figdor C. G. (2003) Curr. Opin. Cell Biol. 15, 539–546 - PubMed
    1. Figdor C. G., van Kooyk Y., Adema G. J. (2002) Nat. Rev. Immunol. 2, 77–84 - PubMed
    1. Robinson M. J., Sancho D., Slack E. C., LeibundGut-Landmann S., Reis e Sousa C. (2006) Nat. Immunol. 7, 1258–1265 - PubMed

Publication types