. 2010 Jun;333(3):883-95.
doi: 10.1124/jpet.109.163154. Epub 2010 Mar 19.

Nitro-oleic acid inhibits firing and activates TRPV1- and TRPA1-mediated inward currents in dorsal root ganglion neurons from adult male rats

Affiliations

Nitro-oleic acid inhibits firing and activates TRPV1- and TRPA1-mediated inward currents in dorsal root ganglion neurons from adult male rats

A Sculptoreanu et al. J Pharmacol Exp Ther. 2010 Jun.

Abstract

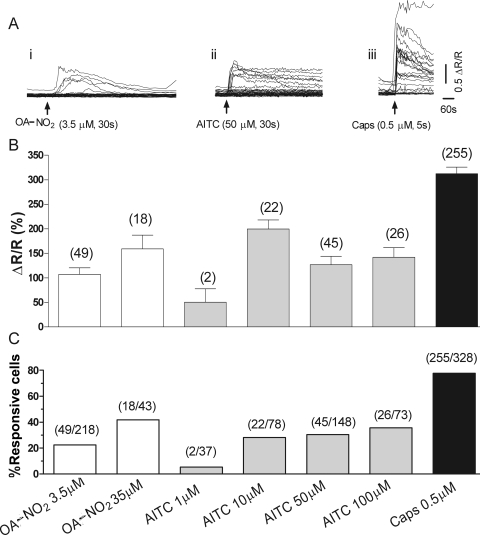
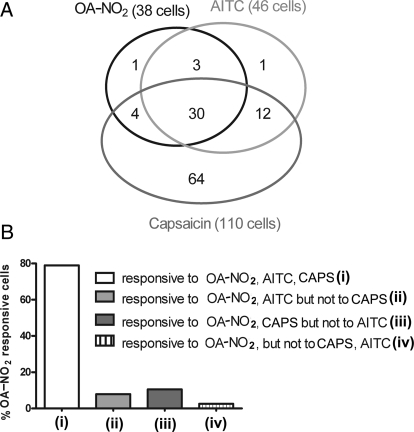
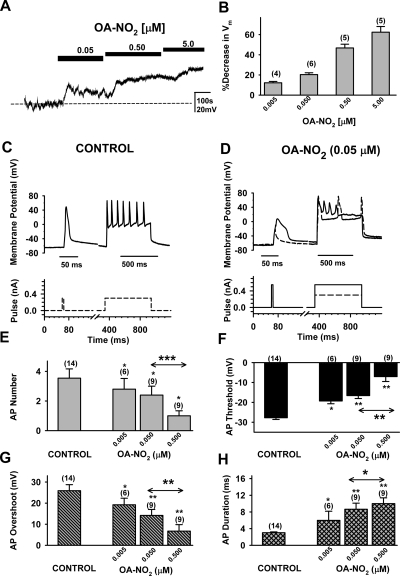
Nitro-oleic acid (OA-NO(2)), an electrophilic fatty acid by-product of nitric oxide and nitrite reactions, is present in normal and inflamed mammalian tissues at up to micromolar concentrations and exhibits anti-inflammatory signaling actions. The effects of OA-NO(2) on cultured dorsal root ganglion (DRG) neurons were examined using fura-2 Ca(2+) imaging and patch clamping. OA-NO(2) (3.5-35 microM) elicited Ca(2+) transients in 20 to 40% of DRG neurons, the majority (60-80%) of which also responded to allyl isothiocyanate (AITC; 1-50 microM), a TRPA1 agonist, and to capsaicin (CAPS; 0.5 microM), a TRPV1 agonist. The OA-NO(2)-evoked Ca(2+) transients were reduced by the TRPA1 antagonist 2-(1,3-dimethyl-2,6-dioxo-1,2,3,6-tetrahydro-7H-purin-7-yl)-N-(4-isopropylphenyl) acetamide (HC-030031; 5-50 microM) and the TRPV1 antagonist capsazepine (10 microM). Patch-clamp recording revealed that OA-NO(2) depolarized and induced inward currents in 62% of neurons. The effects of OA-NO(2) were elicited by concentrations >or=5 nM and were blocked by 10 mM dithiothreitol. Concentrations of OA-NO(2) >or=5 nM reduced action potential (AP) overshoot, increased AP duration, inhibited firing induced by depolarizing current pulses, and inhibited Na(+) currents. The effects of OA-NO(2) were not prevented or reversed by the NO-scavenger carboxy-2-phenyl-4,4,5,5-tetramethylimidazolineoxyl-1-oxyl-3-oxide. A large percentage (46-57%) of OA-NO(2)-responsive neurons also responded to CAPS (0.5 microM) or AITC (0.5 microM). OA-NO(2) currents were reduced by TRPV1 (diarylpiperazine; 5 microM) or TRPA1 (HC-030031; 5 microM) antagonists. These data reveal that endogenous OA-NO(2) generated at sites of inflammation may initially activate transient receptor potential channels on nociceptive afferent nerves, contributing to the initiation of afferent nerve activity, and later suppresses afferent firing.


Figures

Fig. 1.
Fig. 1.
Ca2+ transients induced by OA-NO2, AITC, and CAPS in DRG neurons. A, example of [Ca2+]i changes in response to OA-NO2 (3.5 μM; 30-s duration (i), AITC (50 μM; 30-s duration) (ii), and CAPS (0.5 μM; 5-s duration) (iii). Each line represents a response from one DRG neuron. B, summary of the amplitude of responses to different concentrations of OA-NO2 (white bars), AITC (gray bars), and to CAPS (black bar). Numbers in parentheses represent the number of responsive cells. C, summary of the percentage of cells responding to different concentrations of OA-NO2 (white bars), AITC (gray bars), and to capsaicin (black bar). Concentrations are indicated at the bottom of the graph in C also apply to B. Numbers in parentheses represents the number of cells responding and total number of cells tested.
Fig. 2.
Fig. 2.
DRG neurons responsive to OA-NO2, AITC, and CAPS. A, Venn diagrams illustrating the overlap of cells exhibiting Ca2+ transients in response to OA-NO2, AITC, and CAPS. B, percentage of OA-NO2-responsive cells that respond to both AITC and CAPS (i), that respond to AITC but not to CAPS (ii), that respond to CAPS but not to AITC (iii), and that do not respond to either CAPS or AITC (iv).
Fig. 3.
Fig. 3.
Inhibition of agonist induced Ca2+ transients in DRG neurons by a TRPA1 (HC-030031) and a TRPV1 (capsazepine) antagonist. A, examples from several cells showing responses to OA-NO2 (3.5 μM; 30-s duration) and AITC (10 μM; 30-s duration) in the absence and in the presence of the TRPA1 antagonist HC-030031 (50 μM). HC-030031 completely blocked OA-NO2 and AITC responses but did not affect CAPS response. B, examples from several cells showing responses to OA-NO2 (3.5 μM; 30-s duration) in the absence and in the presence of the TRPV1 antagonist capsazepine (10 μM). Capsazepine reduced OA-NO2 responses and completely blocked CAPS responses (0.5 μM; 5-s duration). Each line represents the response from one DRG neuron.
Fig. 4.
Fig. 4.
Patch-clamp recordings of agonist-induced inward currents in DRG neurons. A, comparison of currents induced by CAPS (0.5 μM) (i), AITC (0.5 μM) (ii), and OA-NO2 (0.5 μM) (iii) in different cells. In another set of experiments agonists were applied in sequence in the same cell: OA-NO2 (0.05 μM) followed by AITC (0.5 μM (iv) and OA-NO2 (0.05 μM) followed by CAPS (0.5 μM) and AITC (0.5 μM) (v). B, average peak current densities (pA/pF) evoked by three concentrations of OA-NO2 alone or in a combination of OA-NO2 (0.05 μM). Absolute responses after sequential administration of either CAPS (0.5 μM; CAPS post-OA-NO2) or AITC (0.5 μM; AITC post-OA-NO2) were obtained by subtracting the steady state OA-NO2 (0.05 μM) current from the total peak current. For comparison, currents in response to either CAPS (0.5 μM; n = 46) or AITC (0.5 μM; n = 5) were obtained in separate experiments. In both sets of experiments, prior application of OA-NO2 significantly reduced the response to either CAPS (p < 0.001) or AITC (p < 0.05). The responses of combined administration to CAPS and AITC (0.5 μM each) are also shown. Peak currents after addition of each drug were measured separately and presented as the sum total of all currents; C, number of neurons that responded to a combination of OA-NO2 and either CAPS (i) or AITC (ii). Number of neurons that responded to CAPS and AITC applied sequentially after OA-NO2 (iii). Unhatched areas indicate responses to a single agent and hatched areas indicate responses to both agents. Number of neurons that did not respond to any of the agonists tested in each group is also shown below the diagrams.
Fig. 5.
Fig. 5.
Time course of CAPS-, AITC-, and OA-NO2-evoked currents. A, averaged currents (symbols) and fitted curves (continuous lines) for currents evoked by OA-NO2 at 0.05 μM (n = 21) or 0.5 μM (n = 13). B, averaged currents (symbols) and fitted curves (continuous lines) for currents evoked by of either CAPS (n = 12; 0.5 μM) or AITC (n = 8; 0.5 μM). C, time to peak for average curves in A and B. D, lag time (time from addition of drug to beginning of response). E to G, time constants for the rising phase and fast and slow time constants for the decaying phase of fitted average currents shown in A and B.
Fig. 6.
Fig. 6.
Block of OA-NO2-evoked currents by TRP antagonists. A, inward currents induced by increasing concentrations of OA-NO2. Block of the OA-NO2-evoked current by a TRPA1 antagonist (HC-030031; 5 μM). B, block of an OA-NO2-evoked current by the reducing agent dithiothreitol (10 mM). C, partial block of an OA-NO2-evoked current by the TRPV1 antagonist diarylpiperazine (5 μM), and the remaining current was blocked by subsequent addition of HC-030031 (5 μM). D, average block of an OA-NO2-evoked current by each antagonist alone or the combination of the two antagonists or by dithiothreitol. Inset shows average time course for prolonged application of OA-NO2 (0.05 μM) in five neurons (empty circles) that was fitted with an equation consisting of one exponential for the rising phase and two exponentials for the decaying phase as explained under Materials and Methods. Inset shows the effect of diarylpiperazine (5 μM) in two neurons. Currents were normalized to the peak inward current in all cells. Statistical comparisons in D (**, p < 0.01) are for average percentage of steady-state block after drugs versus decay of current at the same time point in absence of blockers.
Fig. 7.
Fig. 7.
Average inhibition of OA-NO2 currents by two TRP antagonists. A, effect of diarylpiperazine in six neurons. Average curve of antagonist effect (circles) and its best fit (dotted line) is compared with the best fit (dashed line) of normalized currents averaged in five cells. Time constants immediately before and after antagonist application are also shown. Inset shows a current trace in one neuron in which diarylpiperazine (5 μM) was applied approximately 170 s after OA-NO2; the exponential fits of the current decay before and after antagonist are linearly extrapolated to show the change in the rate of current decline. B, effect of HC-030031 in five neurons. Average curve of antagonist effect (circles) and its best fit (dotted line) is compared with the best fit (dashed continuous line) of normalized currents averaged in five cells. Time constants immediately before and after antagonist application are also shown. Inset shows a current trace in one neuron in which HC-030031 (5 μM) was applied approximately 120 s after OA-NO2, the exponential fits of the current decay before and after antagonist are linearly extrapolated to show the change in the rate of current decline. Statistical difference between control curve and the average curve for the effect of the antagonist was determined by nonlinear regression to be p < 0.001 for the effect of diarylpiperazine in A and p < 0.0001 for the effect of HC-030031 in B.
Fig. 8.
Fig. 8.
Effect of OA-NO2 on membrane potential (A and B) and firing (C–H) in DRG neurons. A, membrane potential change in response to three concentrations of OA-NO2. B, concentration-dependent reduction in membrane potential in response to increasing concentrations of OA-NO2. C and D, firing triggered by short-duration (10 ms) or long-duration (600 ms) current pulses in control (C) and after addition of OA-NO2 (0.05 μM; D). Current intensity of 0.3 nA (dashed lines in C) was sufficient to trigger an AP in response to short-duration pulses and seven APs during a long-duration pulse. After exposure to OA-NO2, the short-duration 0.4 nA stimulus failed to generate an AP, and the long-duration stimulus produced fewer APs (dashed lines in D). Higher stimulus intensity (continuous line in D) triggers an AP with a short-duration pulse, and a long-duration pulse elicited fewer APs than in control recordings (D). E, effect of OA-NO2 on the maximal number of APs generated by long-duration stimuli of submaximal intensities. F, threshold of AP generated by single short pulses (10 ms). G, overshoot of APs generated by single short pulses (10 ms). H, duration of AP at 50% repolarization generated by single short pulses (10 ms). Data from cells shown in E to H are from 14 OA-NO2-responsive cells that also responded to CAPS and/or AITC with an inward current. Statistical comparisons in E to H (*, p < 0.05; **, p < 0.01; ***, p < 0.001) (n) are between control values before application of OA-NO2 and after OA-NO2; values above the arrow line are for comparisons of effects at 0.05 and 0.50 μM OA-NO2.
Fig. 9.
Fig. 9.
NO scavenger cPTIO did not prevent OA-NO2 effects. A, Ca2+ transients evoked by 30 μM OA-NO2 averaged in six neurons in the absence (left traces) and presence (right traces) of 100 μM cPTIO. OA-NO2 (30 μM) was applied alone for 30 s, and the [Ca2+]i was allowed to recover to baseline. cPTIO was applied for 5 min before and during a subsequent 30-s application of OANO2. B, in an AITC/HC-030031-unresponsive cell, OA-NO2 evoked an inward current that was unaffected by subsequent application of PTIO. Application of 10× more OA-NO2 in the presence of OA-NO2 further increased the OA-NO2-evoked current and was nearly completely blocked by diarylpiperazine. C, in the presence of cPTIO, OA-NO2 evoked an inward current that was further increase by submaximal concentrations of AITC and CAPS. In this neuron, the total slowly desensitizing current in the presence of antagonists was blocked by a combined application of diarylpiperazine and HC-030031. Bars above currents traces in B and C represent the time of drug application. Current-voltage curves of Na+ currents (D and F) and representative current traces (at −10 mV, holding potential, −80 mV; E and G) of OA-NO2 effects applied at various concentrations as shown in the absence (D and E) and presence (F and G) of cPTIO. cPTIO (0.5 mM) was applied 3 to 5 min before addition of OA-NO2 (n = 6).

Similar articles

Cited by

References

    1. Baker LM, Baker PR, Golin-Bisello F, Schopfer FJ, Fink M, Woodcock SR, Branchaud BP, Radi R, Freeman BA. (2007) Nitro-fatty acid reaction with glutathione and cysteine. Kinetic analysis of thiol alkylation by a Michael addition reaction. J Biol Chem 282:31085–31093 - PMC - PubMed
    1. Baker PR, Lin Y, Schopfer FJ, Woodcock SR, Groeger AL, Batthyany C, Sweeney S, Long MH, Iles KE, Baker LM, et al. (2005) Fatty acid transduction of nitric oxide signaling: multiple nitrated unsaturated fatty acid derivatives exist in human blood and urine and serve as endogenous peroxisome proliferator-activated receptor ligands. J Biol Chem 280:42464–42475 - PMC - PubMed
    1. Bandell M, Macpherson LJ, Patapoutian A. (2007) From chills to chilis: mechanisms for thermosensation and chemesthesis via thermoTRPs. Curr Opin Neurobiol 17:490–497 - PMC - PubMed
    1. Chen J, Crossland RF, Noorani MM, Marrelli SP. (2009) Inhibition of TRPC1/TRPC3 by PKG contributes to NO-mediated vasorelaxation. Am J Physiol Heart Circ Physiol 297:H417–H424 - PMC - PubMed
    1. Dang K, Bielefeldt K, Gebhart GF. (2004) Gastric ulcers reduce A-type potassium currents in rat gastric sensory ganglion neurons. Am J Physiol Gastrointest Liver Physiol 286:G573–G579 - PubMed

Publication types

MeSH terms