

Quantitative proteomics analysis of inborn errors of cholesterol synthesis: identification of altered metabolic pathways in DHCR7 and SC5D deficiency
- PMID: 20305089
- PMCID: PMC2938083
- DOI: 10.1074/mcp.M900548-MCP200
Quantitative proteomics analysis of inborn errors of cholesterol synthesis: identification of altered metabolic pathways in DHCR7 and SC5D deficiency
Abstract
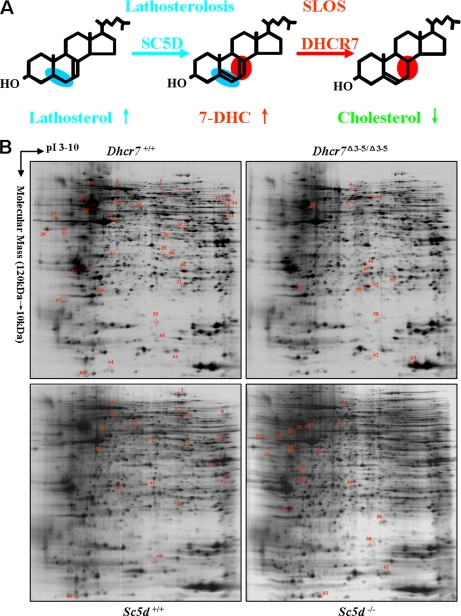
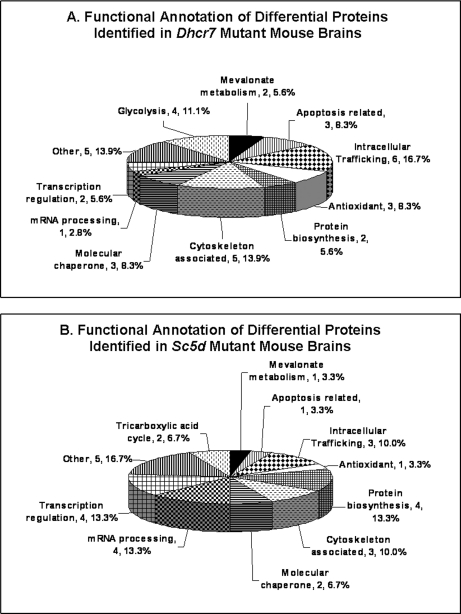
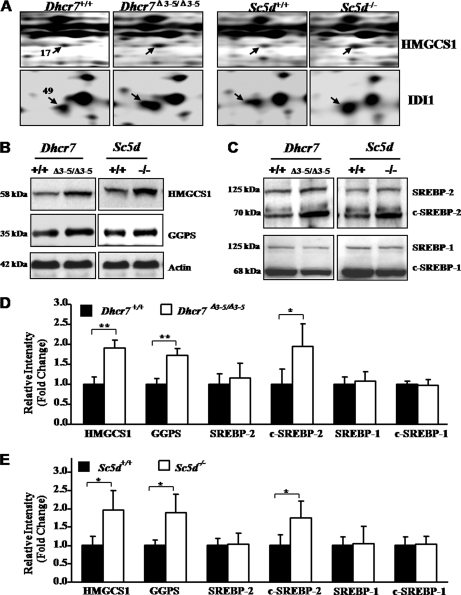
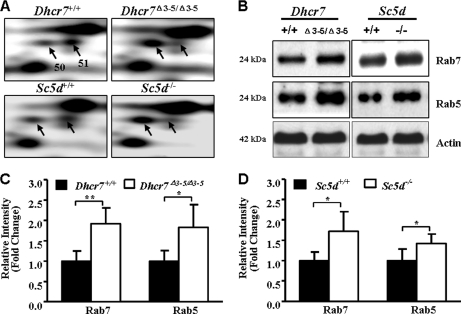
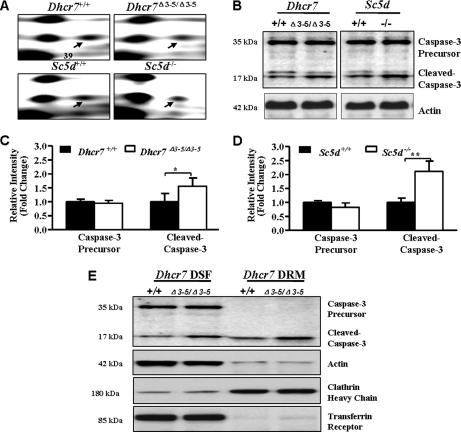
Smith-Lemli-Opitz syndrome (SLOS) and lathosterolosis are malformation syndromes with cognitive deficits caused by mutations of 7-dehydrocholesterol reductase (DHCR7) and lathosterol 5-desaturase (SC5D), respectively. DHCR7 encodes the last enzyme in the Kandutsch-Russel cholesterol biosynthetic pathway, and impaired DHCR7 activity leads to a deficiency of cholesterol and an accumulation of 7-dehydrocholesterol. SC5D catalyzes the synthesis of 7-dehydrocholesterol from lathosterol. Impaired SC5D activity leads to a similar deficiency of cholesterol but an accumulation of lathosterol. Although the genetic and biochemical causes underlying both syndromes are known, the pathophysiological processes leading to the developmental defects remain unclear. To study the pathophysiological mechanisms underlying SLOS and lathosterolosis neurological symptoms, we performed quantitative proteomics analysis of SLOS and lathosterolosis mouse brain tissue and identified multiple biological pathways affected in Dhcr7(Delta3-5/Delta3-5) and Sc5d(-/-) E18.5 embryos. These include alterations in mevalonate metabolism, apoptosis, glycolysis, oxidative stress, protein biosynthesis, intracellular trafficking, and cytoskeleton. Comparison of proteome alterations in both Dhcr7(Delta3-5/Delta3-5) and Sc5d(-/-) brain tissues helps elucidate whether perturbed protein expression was due to decreased cholesterol or a toxic effect of sterol precursors. Validation of the proteomics results confirmed increased expression of isoprenoid and cholesterol synthetic enzymes. This alteration of isoprenoid synthesis may underlie the altered posttranslational modification of Rab7, a small GTPase that is functionally dependent on prenylation with geranylgeranyl, that we identified and validated in this study. These data suggested that although cholesterol synthesis is impaired in both Dhcr7(Delta3-5/Delta3-5) and Sc5d(-/-) embryonic brain tissues the synthesis of nonsterol isoprenoids may be increased and thus contribute to SLOS and lathosterolosis pathology. This proteomics study has provided insight into the pathophysiological mechanisms of SLOS and lathosterolosis, and understanding these pathophysiological changes will help guide clinical therapy for SLOS and lathosterolosis.
Figures
Similar articles
-
Lathosterolosis: an inborn error of human and murine cholesterol synthesis due to lathosterol 5-desaturase deficiency.Hum Mol Genet. 2003 Jul 1;12(13):1631-41. doi: 10.1093/hmg/ddg172. Hum Mol Genet. 2003. PMID: 12812989
-
Development and characterization of a hypomorphic Smith-Lemli-Opitz syndrome mouse model and efficacy of simvastatin therapy.Hum Mol Genet. 2006 Mar 15;15(6):839-51. doi: 10.1093/hmg/ddl003. Epub 2006 Jan 30. Hum Mol Genet. 2006. PMID: 16446309
-
Analysis by liquid chromatography-mass spectrometry of sterols and oxysterols in brain of the newborn Dhcr7(Δ3-5/T93M) mouse: a model of Smith-Lemli-Opitz syndrome.Biochem Pharmacol. 2013 Jul 1;86(1):43-55. doi: 10.1016/j.bcp.2013.03.003. Epub 2013 Mar 13. Biochem Pharmacol. 2013. PMID: 23500538 Free PMC article.
-
Smith-Lemli-Opitz syndrome: pathogenesis, diagnosis and management.Eur J Hum Genet. 2008 May;16(5):535-41. doi: 10.1038/ejhg.2008.10. Epub 2008 Feb 20. Eur J Hum Genet. 2008. PMID: 18285838 Review.
-
Smith-Lemli-Opitz syndrome: the first malformation syndrome associated with defective cholesterol synthesis.Mol Genet Metab. 2000 Sep-Oct;71(1-2):154-62. doi: 10.1006/mgme.2000.3020. Mol Genet Metab. 2000. PMID: 11001806 Review.
Cited by
-
Desmosterolosis and desmosterol homeostasis in the developing mouse brain.J Inherit Metab Dis. 2019 Sep;42(5):934-943. doi: 10.1002/jimd.12088. Epub 2019 Apr 8. J Inherit Metab Dis. 2019. PMID: 30891795 Free PMC article.
-
Mouse knockout of the cholesterogenic cytochrome P450 lanosterol 14alpha-demethylase (Cyp51) resembles Antley-Bixler syndrome.J Biol Chem. 2011 Aug 19;286(33):29086-29097. doi: 10.1074/jbc.M111.253245. Epub 2011 Jun 25. J Biol Chem. 2011. PMID: 21705796 Free PMC article.
-
Metabolic Regulations by lncRNA, miRNA, and ceRNA Under Grass-Fed and Grain-Fed Regimens in Angus Beef Cattle.Front Genet. 2021 Mar 4;12:579393. doi: 10.3389/fgene.2021.579393. eCollection 2021. Front Genet. 2021. PMID: 33747033 Free PMC article.
-
Dietary Cholesterol Supplementation Inhibits the Steroid Biosynthesis but Does Not Affect the Cholesterol Transport in Two Marine Teleosts: A Hepatic Transcriptome Study.Aquac Nutr. 2023 Jun 5;2023:2308669. doi: 10.1155/2023/2308669. eCollection 2023. Aquac Nutr. 2023. PMID: 37312679 Free PMC article.
-
Integrated metabolome and transcriptome analysis reveals key genes and pathways associated with egg yolk percentage in chicken.Poult Sci. 2025 Mar;104(3):104815. doi: 10.1016/j.psj.2025.104815. Epub 2025 Jan 17. Poult Sci. 2025. PMID: 39914020 Free PMC article.
References
-
- Porter F. D. (2008) Smith-Lemli-Opitz syndrome: pathogenesis, diagnosis and management. Eur. J. Hum. Genet. 16, 535–541 - PubMed
-
- Brunetti-Pierri N., Corso G., Rossi M., Ferrari P., Balli F., Rivasi F., Annunziata I., Ballabio A., Russo A. D., Andria G., Parenti G. (2002) Lathosterolosis, a novel multiple-malformation/mental retardation syndrome due to deficiency of 3beta-hydroxysteroid-delta5-desaturase. Am. J. Hum. Genet. 71, 952–958 - PMC - PubMed
Publication types
MeSH terms
Substances
LinkOut - more resources
Full Text Sources
Medical
Miscellaneous
