. 2010 Mar;22(3):672-89.
doi: 10.1105/tpc.109.073668. Epub 2010 Mar 19.

Carbon starved anther encodes a MYB domain protein that regulates sugar partitioning required for rice pollen development

Affiliations

Carbon starved anther encodes a MYB domain protein that regulates sugar partitioning required for rice pollen development

Hui Zhang et al. Plant Cell. 2010 Mar.

Abstract

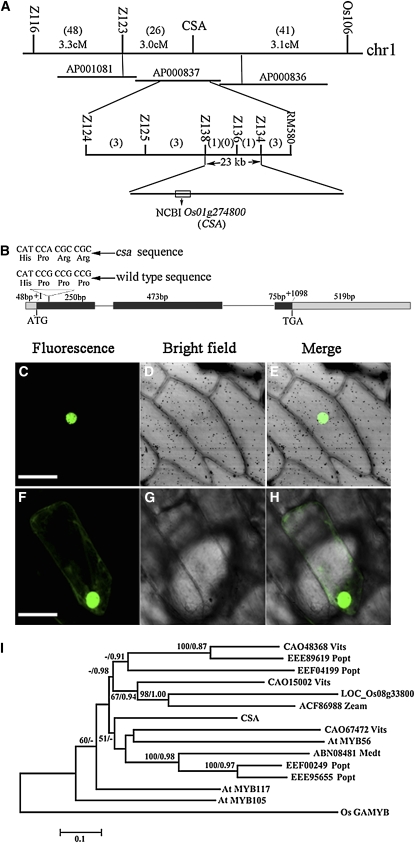
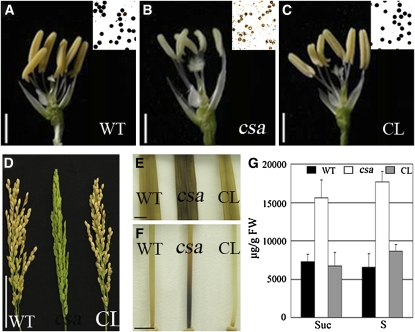
In flowering plants, sink tissues rely on transport of carbohydrates from photosynthetic tissues (sources) for nutrition and energy. However, how sugar partitioning in plants is regulated at the molecular level during development remains unknown. We have isolated and characterized a rice (Oryza sativa) mutant, carbon starved anther (csa), that showed increased sugar contents in leaves and stems and reduced levels of sugars and starch in floral organs. In particular, the csa mutant had reduced levels of carbohydrates in later anthers and was male sterile. The csa mutant had reduced accumulation of (14)C-labeled sugars in anther sink tissue. CSA was isolated by map-based cloning and was shown to encode an R2R3 MYB transcription factor that was expressed preferentially in the anther tapetal cells and in the sugar-transporting vascular tissues. In addition, the expression of MST8, encoding a monosaccharide transporter, was greatly reduced in csa anthers. Furthermore, CSA was found to be associated in vivo and in vitro with the promoter of MST8. Our findings suggest that CSA is a key transcriptional regulator for sugar partitioning in rice during male reproductive development. This study also establishes a molecular model system for further elucidation of the genetic control of carbon partitioning in plants.


Figures

Figure 1.
Figure 1.
Comparison of the Wild Type and the csa Mutant. (A) Comparison of a wild-type plant (left) and a csa mutant plant (right) after heading. Bar = 20 cm. (B) Comparison of the internode elongation of the wild type (left) and csa (right) at the heading stage. Bar = 10 cm. (C) Comparison of the seed setting of the wild type (left) and csa (right). Bar = 5 cm. (D) and (E) The spikelet of the wild type (D) and csa (E) after removing the palea and half the lemma. Bars = 2 mm. (F) and (G) The wild-type anther (F) and the csa anther (G). Bars = 2 mm. (H) and (I) The wild-type pistil (H) and the csa pistil (I). Bars = 2 mm. (J) and (K) The I2-KI staining pollen grains of the wild type (J) and csa (K). Bars = 100 μm. (L) Comparison of plant height between a wild-type plant (black bars) and a csa mutant (white bars). (M) Comparison of the length of panicle and top four internodes (I to IV, where I is the uppermost) between wild-type (black bars) and csa (white bars) plants. Data presented are means of results from 25 plants. Error bars indicate sd. (N) Comparison of relative length percentage of top four internodes between wild-type (left) and csa (right) plants.
Figure 2.
Figure 2.
Transverse Sections Showing Anther and Microspore Development of the Wild Type and csa. Four stages of anther development in the wild type and the corresponding of the csa mutant were compared. Transverse sections were stained with 0.05% toluidine blue O. Images from wild-type plants are shown in (A), (C), (E), and (G); (B), (D), (F), and (H) are the csa mutant. (A) and (B), stage 9; (C) and (D), stage 10; (E) and (F), stage 11; (G) and (H), stage 13. E, epidermis; En, endothecium; ML, middle layer; T, tapetum; Msp, microspore; MP, mature pollen; St, stomium. Bars = 15 μm.
Figure 3.
Figure 3.
I2-KI Staining the Flag Leaf and Stem in Wild Type and csa. (A) I2-KI staining of flag leaves from the wild type (left) and csa (right) at stage 11. (B) I2-KI staining of flag leaves from the wild type (left) and csa (right) at stage 13. (C) I2-KI staining of stems from the wild type (top) and csa (bottom) at stage 11. (D) I2-KI staining of stems from the wild type (top) and csa (bottom) at stage 13. Arrows in (C) and (D) indicate starch deposition. (E) and (G) I2-KI–stained free-hand sections of stem cell division zones of the wild type (E) and csa (G) at stage 11. (F) and (H) I2-KI–stained free-hand sections of stem cell division zones from the wild type (F) and csa (H) at stage 13. Arrows indicate starch deposition in (C) and (D); arrows indicate the vascular tissue (VT) in (E) to (H). Bars = 1cm in (C) and (D) and 150 μm in (E) to (H).
Figure 4.
Figure 4.
Sugar and Starch Levels in the Wild Type and csa. Sugar and starch levels at stages 9, 11, and 13 in anther (A), lemma/palea (B), and flag leaf (C). Data presented are means ± se (n = 3) with units of μg/g FW. Fru, fructose; Glu, glucose; Suc, sucrose; S, starch.
Figure 5.
Figure 5.
14C-Signal Accumulation in the Flower/Anther and Stem of the Wild Type and csa after 12-h Treatment. (A) 14C-signal accumulation in the stems of wild-type and csa plants at stage 11. (B) 14C-signal accumulation in the stems of the wild type and csa at stage 13. (C) 14C-signal accumulation in the anther of the wild type and csa at stages 9, 11, and 13. (D) 14C-signal accumulation in the lemma/palea of the wild type and csa at stages 9, 11, and 13. S1 to S3, stem segments from the base to the top. The data are given as means ± se (n = 3). The unit is expressed as cpm/mg, FW.
Figure 6.
Figure 6.
Molecular Identification of CSA. (A) Fine mapping of the CSA gene on chromosome 1. Names and positions of the molecular markers are indicated on the vertical line. AP000837 is the accession number of the relevant genomic sequence. cM is the unit of genetic distance (centimorgans). Numbers in parentheses represent recombination events in the appropriate interval. The CSA locus was mapped to a 23-kb region between molecular markers Z134 and Z138. (B) A schematic representation of the exon and intron organization of CSA. The mutant sequence has a nucleotide deletion and a G-to-A transition in the first exon. +1 Indicates the starting nucleotide of translation, and the stop codon (TAG) is +1098. Black boxes indicate exons; intervening lines indicate introns; gray boxes indicate untranslated regions. (C) to (E) The onion epidermal cell that expressed CSA-GFP. (F) to (H) The onion epidermal cell that expressed GFP as control. Bars = 50 μm, all six panels are at the same magnification. (I) Phylogenetic analysis of CSA and its 14 close homologs. The proteins were named according to their gene names from Arabidopsis thaliana and rice, and others were according to their National Center for Biotechnology Information accession numbers followed by their species names (abbreviation). Os GAMYB is defined as an outgroup. The scale bar indicates the number of amino acid substitutions per site. The alignment for the constructed tree is shown in Supplemental Figure 6 online, with sequences listed in Supplemental Data Set 1 online.
Figure 7.
Figure 7.
Complementation of the csa Mutant and Phenotype Analysis. (A) to (C) Anthers and I2-KI–stained pollen grains of the wild type (A), the csa mutant (B), and the complemented line ([C]; CL). (D) Comparison of the seed setting of the wild type, csa, and the complemented line. (E) I2-KI–stained flag leaves of the wild type, csa, and the complemented line at stage 13. (F) I2-KI–stained internode I stems of the wild type, csa, and the complemented line at stage 13. (G) Sucrose and starch levels in flag leaves of the wild type, csa, and the complemented line at stage 13. Bars = 2 mm in (A) to (C), 5 cm in (D), and 1 cm in (E) and (F). Suc, sucrose; S, starch.
Figure 8.
Figure 8.
CSA Expression Pattern. (A) Spatial and temporal expression analyses of CSA by RT-PCR. RNAs were extracted from the root of 15-d-old seedlings, the shoot, leaf, glume, and lemma/palea from the plants at heading stage. L/P, lemma and palea. (B) to (K) GUS activity in the pCSA-GUS line. (B) CSA expression in the root vascular tissue. (C) GUS activity in the region of lateral root initiation. (D) GUS activity in the leaf collar. (E) GUS activity in the wounding tissue. (F) GUS activity in the lemma/palea. (G) GUS activity in the pistil. (H) to (K) GUS activities in anther of stage 9 (H), stage 10 (I), stage 11 (J), and stage 13 (K). (L) to (S) In situ analyses of the CSA expression in anther at stage 9 ([L] and [M]), stage 11 ([N] and [O]), and stage 13 ([P] and [Q]). (R) and (S) In situ analyses of CSA expression in the root; pink color in (R) indicates the CSA expression. (L), (N), (P), and (R) Probed with the CSA antisense probe. (M), (O), (Q), and (S) Probed with the CSA sense probe. Arrows indicate the CSA expression positions. T, tapetum; Msp, microspore; VT, vascular tissue. Bars = 1 mm in (B) and (C), 1 cm in (D) and (E), 2 mm in (F) to (K), 30 μm in (L) to (Q), and 60 μm in (R) and (S).
Figure 9.
Figure 9.
Regulation of Rice MST8 by CSA. (A) and (B) Relative mRNA levels of MST8 in the anther (A) and the lemma/palea (B) of the wild type (black), csa (white), and complemented line (CL) (gray) analyzed by real-time PCR. Error bars indicate sd; each reaction has four quantitative PCR biological replicates. (C) Predicted CCAAT-boxes of rice MST8 and ACTIN1 upstream regions. Black boxes indicate canonical binding sites for plant R2R3-MYB proteins of the form pyAAC(G/T)G (CCAAT-box); numbers indicate the position of these motifs relative to the putative transcriptional start site; the bent arrow denotes the translational start site. The gray fragments (MST8-1, MST8-2, MST8-3, and Actin1) indicate the position used in ChIP-qPCR assays. MST8-1 and MST8-2 contain the predicted CCAAT-motif, and MST8-3 has no predicted CCAAT-motif as the control. The black fragment (MST8-4) with two predicted CCAAT-motifs was used in gel shift assays. (D) ChIP enrichment test by PCR shows the binding of CSA to the regulatory region of MST8-1 and MST8-2. The fold enrichments in the IP sample over the minus antibody control are shown. Error bars indicate sd; each reaction has four quantitative PCR biological replicates. (E) Recombinant CSA binding to the promoter region of MST8-4 with containing two CCAAT-boxes was determined by EMSA. The binding complex could be outcompeted with increasing quantities of unlabeled MST8-4 DNA fragments (×25, ×50, and ×100 of unlabeled MST8-4 DNA fragments).

References

    1. Abebe T., Skadsen R.W., Kaeppler H.F. (2004). Cloning and identification of highly expressed genes in barley lemma and palea. Crop Sci. 44: 942–950
    1. Aoki N., Hirose T., Scofield G.N., Whitfeld P.R., Furbank R.T. (2003). The sucrose transporter gene family in rice. Plant Cell Physiol. 44: 223–232 - PubMed
    1. Buttner M. (2007). The monosaccharide transporter(-like) gene family in Arabidopsis. FEBS Lett. 581: 2318–2324 - PubMed
    1. Chen L., Chu H.W., Yuan Z., Pan A.H., Liang W.Q., Huang H., Shen M.S., Zhang D., Chen L. (2006a). Isolation and genetic analysis for rice mutants treated with 60 Co γ-Ray. J. Xiamen Univ. 45: 82–85
    1. Chen R., Zhao X., Shao Z., Wei Z., Wang Y., Zhu L., Zhao J., Sun M., He R., He G. (2007). Rice UDP-glucose pyrophosphorylase1 is essential for pollen callose deposition and its cosuppression results in a new type of thermosensitive genic male sterility. Plant Cell 19: 847–861 - PMC - PubMed

Publication types

LinkOut - more resources