. 2010 May 1;26(9):1160-8.
doi: 10.1093/bioinformatics/btq100. Epub 2010 Mar 19.

ProBiS algorithm for detection of structurally similar protein binding sites by local structural alignment

Affiliations

ProBiS algorithm for detection of structurally similar protein binding sites by local structural alignment

Janez Konc et al. Bioinformatics. .

Abstract

Motivation: Exploitation of locally similar 3D patterns of physicochemical properties on the surface of a protein for detection of binding sites that may lack sequence and global structural conservation.

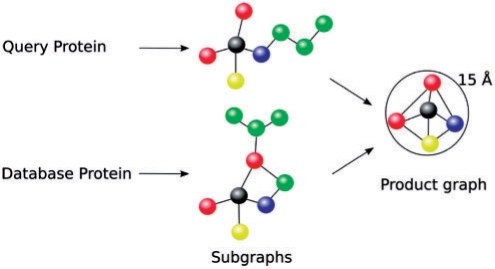
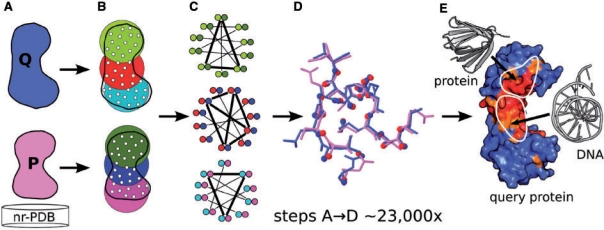
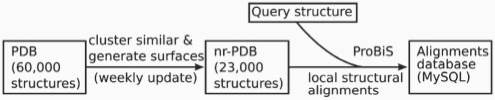
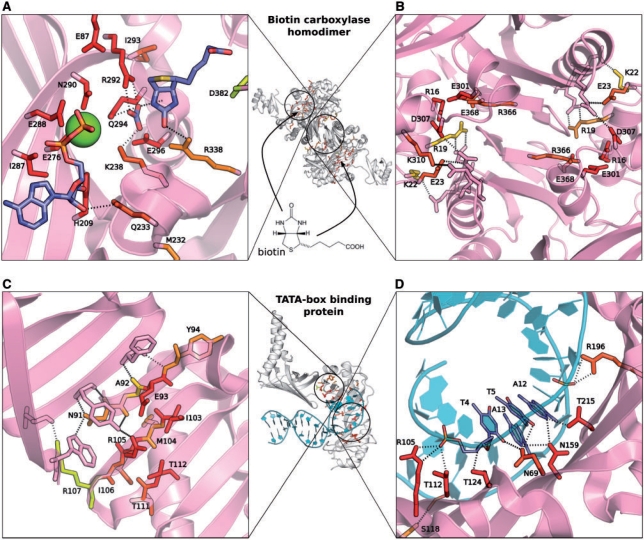
Results: An algorithm, ProBiS is described that detects structurally similar sites on protein surfaces by local surface structure alignment. It compares the query protein to members of a database of protein 3D structures and detects with sub-residue precision, structurally similar sites as patterns of physicochemical properties on the protein surface. Using an efficient maximum clique algorithm, the program identifies proteins that share local structural similarities with the query protein and generates structure-based alignments of these proteins with the query. Structural similarity scores are calculated for the query protein's surface residues, and are expressed as different colors on the query protein surface. The algorithm has been used successfully for the detection of protein-protein, protein-small ligand and protein-DNA binding sites.

Availability: The software is available, as a web tool, free of charge for academic users at http://probis.cmm.ki.si.


Figures

Fig. 1.
Fig. 1.
Different functional groups in proteins are assigned distinct labels (see color encoding). Subgraphs are generated from the query protein and each database protein and then used to produce product graphs which reveal the extent of superposition of any pair of subgraphs.
Fig. 2.
Fig. 2.
Schematic representation of the ProBiS algorithm. (A) The query protein structure (Q) is compared in a pairwise manner with each of ∼23 000 non-redundant structures (P). (B) Proteins, represented as graphs of vertices (white dots) and edges (not shown), are divided into n overlapping subgraphs, where n equals the number of vertices and all vertices are within 15 Å of a central vertex: three subgraphs per protein are depicted here as distinctly colored encirclements. A fast distance-matrix-based filtering is applied to them to eliminate non-similar subgraphs. (C) A product graph is constructed for each similar pair of subgraphs (see color encoding in B and C). A maximum clique (thick lines) in a product graph represents the largest similarity between two compared protein subgraphs. (D) Each maximum clique produces a structural alignment of two compared proteins (the alignment shown corresponds to the middle maximum clique in C). (E) Steps A–D are repeated for each protein from the nr-PDB and the results are stored in a MySQL database. Structural similarity scores are calculated and projected on the query protein surface. Structurally similar and variable residues are colored red and blue, respectively. High-scoring residues are considered as predicted structurally similar binding sites.
Fig. 3.
Fig. 3.
Schematic representation of nr-PDB database preparation, conversion to a surface representation and ProBiS results database (MySQL).
Fig. 4.
Fig. 4.
Structural similarity pattern in the homodimer protein biotin carboxylase (PDB: 1bnc) and in the TATA-binding protein (TBP) (PDB: 1ytf). The proteins are represented as pink cartoon models, TATA box DNA as cyan cartoon model; the structurally similar residues are shown as yellow, orange and red stick models and the interacting residues on the opposing chains are shown as pink stick models. Hydrogen bond pattern occurring (A) between biotin carboxylase and bound ligands, biotin, ADP, Mg2+ and bicarbonate ion; (B) between the two subunits of biotin carboxylase; (C) between the TBP and the transcription factor IIA and (D) between the TBP and the TATA box DNA is shown.

References

    1. Altschul SF, Gish W. Local alignment statistics. Methods Enzymol. 1996;266:460–480. - PubMed
    1. Altschul SF, et al. Gapped BLAST and PSI-BLAST: a new generation of protein database search programs. Nucleic Acids Res. 1997;25:3389–3402. - PMC - PubMed
    1. Angaran S, et al. MolLoc: a web tool for the local structural alignment of molecular surfaces. Nucleic Acids Res. 2009;37:W565–W570. - PMC - PubMed
    1. Ausiello G, et al. FunClust: a web server for the identification of structural motifs in a set of non-homologous protein structures. BMC Bioinformatics. 2008;9:S2. - PMC - PubMed
    1. Berman HM, et al. The protein data bank. Acta Crystallogr. D. 2002;D58:899–907. - PubMed

Publication types