

miR-519 suppresses tumor growth by reducing HuR levels
- PMID: 20305372
- PMCID: PMC3057889
- DOI: 10.4161/cc.9.7.11164
miR-519 suppresses tumor growth by reducing HuR levels
Abstract
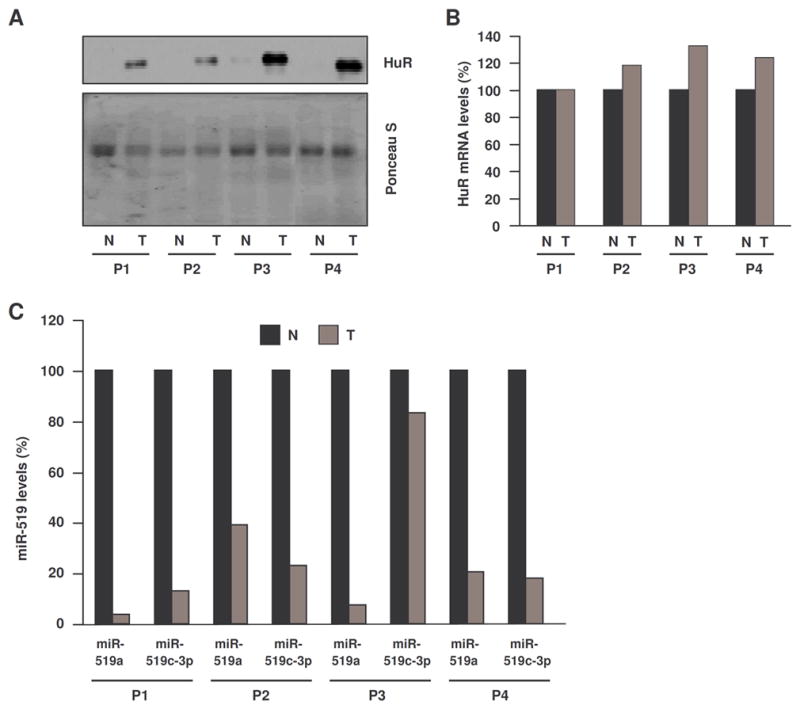
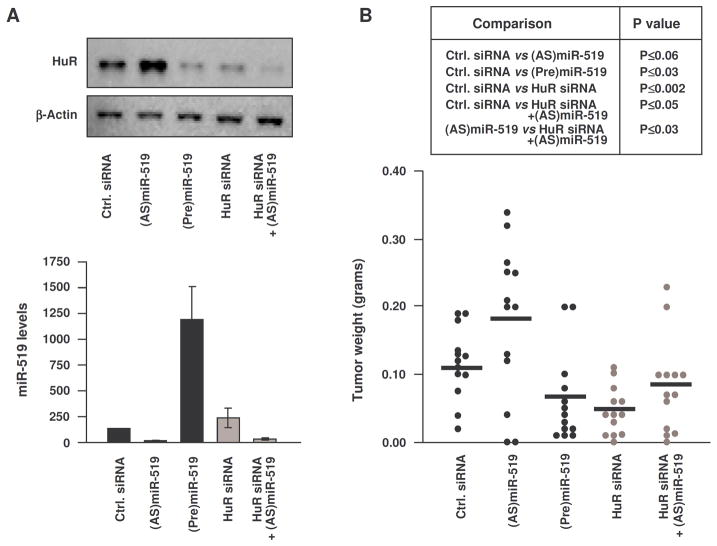
The RNA-binding protein HuR is highly abundant in many cancers. HuR expression was recently found to be repressed by microRNA miR-519, which potently lowered HuR translation without influencing HuR mRNA abundance. Here, we examined the levels of HuR and miR-519 in pairs of cancer and adjacent healthy tissues from ovary, lung, and kidney. In the three sample collections, the cancer specimens showed dramatically higher HuR levels, unchanged HuR mRNA concentrations, and markedly reduced miR-519 levels, when compared with healthy tissues. As tested using human cervical carcinoma cells, miR-519 reduced tumorigenesis in athymic mice. Compared with the tumors arising from control cells, cells overexpressing miR-519 formed significantly smaller tumors, while cells expressing reduced miR-519 levels gave rise to substantially larger tumors. Evidence that the miR-519-elicited reduction of HuR was critical for its tumor suppressor influence was obtained by reducing HuR, as HuR-silenced cells formed markedly smaller tumors and were unable to form large tumors even after lowering miR-519 abundance. Together, our data reveal that miR-519 inhibits tumorigenesis in large part by repressing HuR expression.
Figures


Comment in
-
Tumor suppressor effect of the microRNA miR-519 is mediated via the mRNA-binding protein HuR.Cell Cycle. 2010 Apr 1;9(7):1234. Epub 2010 Apr 1. Cell Cycle. 2010. PMID: 20404521 No abstract available.
-
MicroRNA-RNA binding protein face-off in cancer.Cell Cycle. 2010 Apr 1;9(7):1234-5. Epub 2010 Apr 1. Cell Cycle. 2010. PMID: 20404526 No abstract available.
Similar articles
-
Tumor suppressor effect of the microRNA miR-519 is mediated via the mRNA-binding protein HuR.Cell Cycle. 2010 Apr 1;9(7):1234. Epub 2010 Apr 1. Cell Cycle. 2010. PMID: 20404521 No abstract available.
-
miR-519 reduces cell proliferation by lowering RNA-binding protein HuR levels.Proc Natl Acad Sci U S A. 2008 Dec 23;105(51):20297-302. doi: 10.1073/pnas.0809376106. Epub 2008 Dec 16. Proc Natl Acad Sci U S A. 2008. PMID: 19088191 Free PMC article.
-
Competitive regulation of nucleolin expression by HuR and miR-494.Mol Cell Biol. 2011 Oct;31(20):4219-31. doi: 10.1128/MCB.05955-11. Epub 2011 Aug 22. Mol Cell Biol. 2011. PMID: 21859890 Free PMC article.
-
Translational control of TOP2A influences doxorubicin efficacy.Mol Cell Biol. 2011 Sep;31(18):3790-801. doi: 10.1128/MCB.05639-11. Epub 2011 Jul 18. Mol Cell Biol. 2011. PMID: 21768308 Free PMC article.
-
HuR in the mammalian genotoxic response: post-transcriptional multitasking.Cell Cycle. 2003 Sep-Oct;2(5):412-4. Cell Cycle. 2003. PMID: 12963828 Review. No abstract available.
Cited by
-
HuR inhibits apoptosis by amplifying Akt signaling through a positive feedback loop.J Cell Physiol. 2013 Jan;228(1):182-9. doi: 10.1002/jcp.24120. J Cell Physiol. 2013. PMID: 22674407 Free PMC article.
-
MicroRNAs targeted mTOR as therapeutic agents to improve radiotherapy outcome.Cancer Cell Int. 2024 Jul 4;24(1):233. doi: 10.1186/s12935-024-03420-3. Cancer Cell Int. 2024. PMID: 38965615 Free PMC article. Review.
-
Molecular mechanism of miR-34b-5p and RNA binding protein HuR binding to lncRNA OIP5-AS1 in colon cancer cells.Cancer Gene Ther. 2022 May;29(5):612-624. doi: 10.1038/s41417-021-00342-4. Epub 2021 May 21. Cancer Gene Ther. 2022. PMID: 34021273
-
Insights from the HuR-interacting transcriptome: ncRNAs, ubiquitin pathways, and patterns of secondary structure dependent RNA interactions.Mol Genet Genomics. 2012 Dec;287(11-12):867-79. doi: 10.1007/s00438-012-0722-8. Epub 2012 Oct 4. Mol Genet Genomics. 2012. PMID: 23052832
-
MicroRNAs, Tristetraprolin Family Members and HuR: A Complex Interplay Controlling Cancer-Related Processes.Cancers (Basel). 2022 Jul 20;14(14):3516. doi: 10.3390/cancers14143516. Cancers (Basel). 2022. PMID: 35884580 Free PMC article. Review.
References
-
- Hanahan D, Weinberg RA. The hallmarks of cancer. Cell. 2000;100:57–70. - PubMed
-
- Lukong KE, Chang KW, Khandjian EW, Richard S. RNA-binding proteins in human genetic disease. Trends Genet. 2008;24:416–25. - PubMed
-
- Kim VN, Han J, Siomi MC. Biogenesis of small RNAs in animals. Nat Rev Mol Cell Biol. 2009;10:126–39. - PubMed
Publication types
MeSH terms
Substances
Grants and funding
LinkOut - more resources
Full Text Sources
Other Literature Sources
Research Materials
Miscellaneous