. 2010 Apr;66(4):736-43.
doi: 10.1227/01.NEU.0000367631.02903.50.

The brain tumor window model: a combined cranial window and implanted glioma model for evaluating intraoperative contrast agents

Affiliations

The brain tumor window model: a combined cranial window and implanted glioma model for evaluating intraoperative contrast agents

Daniel A Orringer et al. Neurosurgery. 2010 Apr.

Abstract

Objective: Optical contrast agents for brain tumor delineation have been previously evaluated in ex vivo specimens from animals with implanted gliomas and may not reflect the true visual parameters encountered during surgery. This study describes a novel model system designed to evaluate optical contrast agents for tumor delineation in vivo.

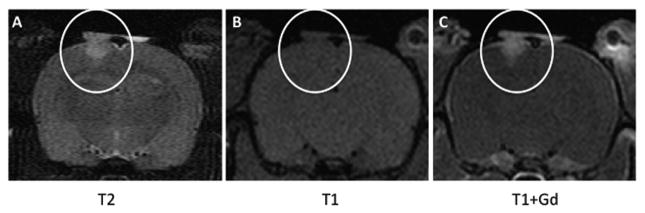
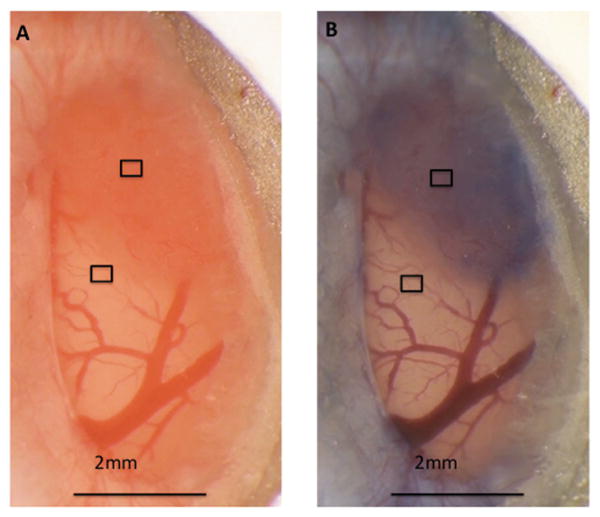
Methods: Biparietal craniectomies were performed on 8-week-old Sprague-Dawley rats. 9L glioma cells were injected intraparenchymally. A cover slip was bonded to the cranial defect with cyanoacrylate glue. When the tumor radius reached 1 mm, Coomassie Blue was administered intravenously while the appearance of the cortical surface was recorded. Computerized image analysis of the red/green/blue color components was used to quantify visible differences between tumor and nonneoplastic tissue and to compare delineation in the brain tumor window (BTW) model with the conventional 9L glioma model.

Results: The tumor margin in the BTW model was poorly defined before contrast administration but readily apparent after contrast administration. Based on red component intensity, tumor delineation improved 4-fold at 50 minutes after contrast administration in the BTW model (P < .002). The conventional 9L glioma model overestimated the degree of delineation compared with the BTW model at the same dose of Coomassie Blue (P < .03).

Conclusion: Window placement overlying an implanted glioma is technically possible and well tolerated in the rat. The BTW model is a valid system for evaluating optical contrast agents designed to delineate brain tumor margins. To our knowledge, we have described the first in vivo model system for evaluating optical contrast agents for tumor delineation.


Figures

Figure 1
Figure 1
Key operative steps in the brain tumor window model: A. reflection of scalp flaps laterally with placement of retracting sutures; B. biparietal craniectomy; C. biparietal, semilunar durotomy; note how the appearance of the arachnoid, pia and surface vessels are clearly visualized here; D. subcortical tumor injection; E. bonding of glass coverslip to margins of cranial defect; F. attachment of plastic ring to skin flap edges.
Figure 2
Figure 2
A. Photographs of tumor growth following window and tumor implantation. Postoperative day is listed below each image. The white circle indicates the general region where tumor growth is noted. B. Average tumor volume following implantation. The calculated average tumor doubling time is 1.2 days. Values indicate ± SEM (n=6).
Figure 2
Figure 2
A. Photographs of tumor growth following window and tumor implantation. Postoperative day is listed below each image. The white circle indicates the general region where tumor growth is noted. B. Average tumor volume following implantation. The calculated average tumor doubling time is 1.2 days. Values indicate ± SEM (n=6).
Figure 3
Figure 3
MRI of brain tumor window model 12 days following implantation A. T2 weighted MRI B. T1 weighted MRI without gadolinium C. T1 weighted MRI post gadolinium. Tumor is highlighted with a white circle. MRI shown is representative of all animals used for evaluating delineation in the BTW model.
Figure 4
Figure 4
Photographs of a representative brain tumor window model before (A) and 25 minutes after coomassie blue administration (B). Sample regions of interest are indicated by the black boxes. Quantification of red hue within regions of interest over the course of the 2 hour experiment (C). Values indicated are averages from three regions of interest. Error bars indicate ± SEM (n=6).
Figure 4
Figure 4
Photographs of a representative brain tumor window model before (A) and 25 minutes after coomassie blue administration (B). Sample regions of interest are indicated by the black boxes. Quantification of red hue within regions of interest over the course of the 2 hour experiment (C). Values indicated are averages from three regions of interest. Error bars indicate ± SEM (n=6).
Figure 5
Figure 5
Gross (A,B) and microscopic pathology (C,D) of specimens from brain tumor window model animals. Note the generally spherical shape of the implanted tumor on gross and microscopic specimens. Also note the fronds of tumor tissue infiltrating into the surrounding cortex (D).
Figure 6
Figure 6
Photographs of conventional implant model (A) and brain tumor window model (B) 25 minutes after coomassie blue administration. Note the effect of physiologic cerebral perfusion on the appearance of the normal cortex and brain tumor in the BTW model. Quantification of red hue within tumor and normal brain (C). The significant difference between red hue of the tumor and normal brain is also depicted (p<0.0002, indicated by dagger). This difference in the appearance between normal brain and tumor tissue is significantly smaller in the brain tumor window model than the implanted model (p<0.03, indicated by asterisk). Values indicate ± SEM (n=6).
Figure 7
Figure 7
Normalized analysis of change in red hue on post coomassie blue administration images from BTW and conventional implanted glioma animals and in gray scale on post-contrast MRI. The asterisk indicates the point where a significant difference in red hue or gray scale value occurs in comparison to normal brain (p<0.02, n=6). All points to the left of the asterisk are also statistically different in red hue or gray scale from normal brain. The visually apparent tumor margin is indicated by the vertical dashed line; all points to the left of the line are within the tumor, while all points to the right of the line are within normal brain.

Similar articles

Cited by

References

    1. Central Brain Tumor Registry of the United States. Primary Brain Tumors in the United States Statistical Report. 2007 http://www.cbtrus.org/reports//2007-2008/2007report.pdf. Updated Last Updated Date.
    1. Sanai N, Berger MS. Glioma extent of resection and its impact on patient outcome. Neurosurgery. 2008 Apr;62(4):753–764. discussion 264-756. - PubMed
    1. Britz G, Ghatan S, Spence AM, Berger MS. Intracarotid RMP-7 enhanced indocyanine green staining of tumors in a rat glioma model. Journal of Neurooncology. 2002;56:227–232. - PubMed
    1. Hansen D, Spence AM, Carski T, Berger M. Indocyanine green (ICG) staining and demarcation of tumor margins in a rat glioma model. Surgical Neurology. 1993;40:451–456. - PubMed
    1. Moore G. Fluorescein as an agent in the differentiation of normal and malignant tissues. Science. 1947;106:130–131. - PubMed

Publication types