

Comparative Study
doi: 10.1038/nn.2511.
Epub 2010 Mar 21.
Microglial Cx3cr1 knockout prevents neuron loss in a mouse model of Alzheimer's disease
Affiliations
- PMID: 20305648
- PMCID: PMC4072212
- DOI: 10.1038/nn.2511
Item in Clipboard
Comparative Study
Microglial Cx3cr1 knockout prevents neuron loss in a mouse model of Alzheimer's disease
Nat Neurosci.
2010 Apr.
Abstract
Microglia, the immune cells of the brain, can have a beneficial effect in Alzheimer's disease by phagocytosing amyloid-beta. Two-photon in vivo imaging of neuron loss in the intact brain of living Alzheimer's disease mice revealed an involvement of microglia in neuron elimination, indicated by locally increased number and migration velocity of microglia around lost neurons. Knockout of the microglial chemokine receptor Cx3cr1, which is critical in neuron-microglia communication, prevented neuron loss.
Figures
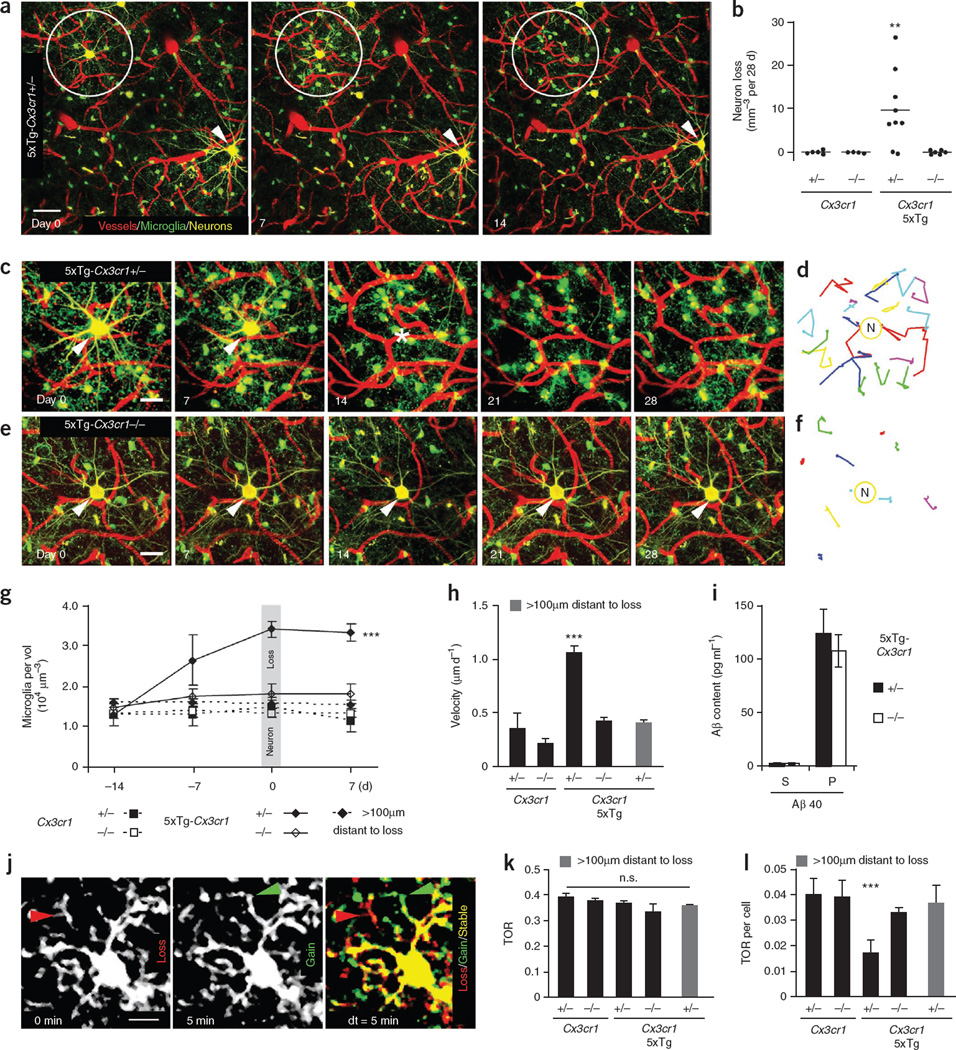
Microglial CX3CR1-dependent neuron loss in 5xTg mice. (a) Fluorescence two-photon in vivo images of neurons (yellow), microglia (green) and blood vessels (red) before (day 0), at (day 7) and after (day 14) neuron loss. Circles indicate lost neurons and arrows indicate present neurons. (b) Neuron loss per volume over a 28-d imaging interval (n = 4–9 mice per genotype, aged 4–6 months). (c–f) High-magnification time-lapse images (c) of a lost neuron in a and a neuron from a 5xTg-Cx3cr1−/− mouse (e). Traces of individual microglia in c and e are shown in d and f. (g) Microglia density of different genotypes (n = 4 per group) over time in a volume of 7.5 × 105 µm3 around neurons as in c and e and more than 100 µm distant. Note that microglia density increased before neuron loss. (h) Mean migration velocity of microglia somata over 28 d (n = 4 per group). (i) Soluble (S) and insoluble (P) Aβ40 content in brain homogenates of 5xTg-Cx3cr1+/− and 5xTg-Cx3cr1−/− mice (n = 5 per group). (j) Subsequent time points (0 min, 5 min) were superimposed (dt = 5 min) to measure gained (green arrow), lost (red arrow) and stable (yellow area) processes. (k,l) Microglia TOR (k) and TOR per cell (l) of various genotypes (n = 4 mice per group) and at more than 100 µm from neuron loss. Scale bars represent 20 µm (a), 10 µm (c,e) and 5 µm (j). **P < 0.01, ***P < 0.001. Error bars indicate s.e.m.
Similar articles
-
CX3CR1 deficiency alters microglial activation and reduces beta-amyloid deposition in two Alzheimer's disease mouse models.Am J Pathol. 2010 Nov;177(5):2549-62. doi: 10.2353/ajpath.2010.100265. Epub 2010 Sep 23. Am J Pathol. 2010. PMID: 20864679 Free PMC article.
-
Heterozygous CX3CR1 Deficiency in Microglia Restores Neuronal β-Amyloid Clearance Pathways and Slows Progression of Alzheimer's Like-Disease in PS1-APP Mice.Front Immunol. 2019 Dec 2;10:2780. doi: 10.3389/fimmu.2019.02780. eCollection 2019. Front Immunol. 2019. PMID: 31849963 Free PMC article.
-
CX3CR1 protein signaling modulates microglial activation and protects against plaque-independent cognitive deficits in a mouse model of Alzheimer disease.J Biol Chem. 2011 Sep 16;286(37):32713-22. doi: 10.1074/jbc.M111.254268. Epub 2011 Jul 19. J Biol Chem. 2011. PMID: 21771791 Free PMC article.
-
Effects of CX3CR1 and Fractalkine Chemokines in Amyloid Beta Clearance and p-Tau Accumulation in Alzheimer's Disease (AD) Rodent Models: Is Fractalkine a Systemic Biomarker for AD?Curr Alzheimer Res. 2016;13(4):403-12. doi: 10.2174/1567205013666151116125714. Curr Alzheimer Res. 2016. PMID: 26567742 Review.
-
Should We Open Fire on Microglia? Depletion Models as Tools to Elucidate Microglial Role in Health and Alzheimer's Disease.Int J Mol Sci. 2021 Sep 8;22(18):9734. doi: 10.3390/ijms22189734. Int J Mol Sci. 2021. PMID: 34575898 Free PMC article. Review.
Cited by
-
A multidisciplinary approach unravels early and persistent effects of X-ray exposure at the onset of prenatal neurogenesis.J Neurodev Disord. 2015;7(1):3. doi: 10.1186/1866-1955-7-3. Epub 2015 Jan 9. J Neurodev Disord. 2015. PMID: 26029273 Free PMC article.
-
Neuroinflammation in Prion Disease.Int J Mol Sci. 2021 Feb 23;22(4):2196. doi: 10.3390/ijms22042196. Int J Mol Sci. 2021. PMID: 33672129 Free PMC article. Review.
-
Activation of mGluR1 Mediates C1q-Dependent Microglial Phagocytosis of Glutamatergic Synapses in Alzheimer's Rodent Models.Mol Neurobiol. 2019 Aug;56(8):5568-5585. doi: 10.1007/s12035-019-1467-8. Epub 2019 Jan 16. Mol Neurobiol. 2019. PMID: 30652266 Free PMC article.
-
Microglial priming of antigen presentation and adaptive stimulation in Alzheimer's disease.Cell Mol Life Sci. 2019 Oct;76(19):3681-3694. doi: 10.1007/s00018-019-03132-2. Epub 2019 May 15. Cell Mol Life Sci. 2019. PMID: 31093687 Free PMC article. Review.
-
Microglia convert aggregated amyloid-β into neurotoxic forms through the shedding of microvesicles.Cell Death Differ. 2014 Apr;21(4):582-93. doi: 10.1038/cdd.2013.180. Epub 2013 Dec 13. Cell Death Differ. 2014. PMID: 24336048 Free PMC article.
References
Publication types
MeSH terms
Substances
Grants and funding
LinkOut - more resources
Full Text Sources
Other Literature Sources
Medical
Molecular Biology Databases
