

doi: 10.1039/b817667c.
Multifunctional Nanoparticles as Biocompatible Targeted Probes for Human Cancer Diagnosis and Therapy
Affiliations
- PMID: 20305738
- PMCID: PMC2841409
- DOI: 10.1039/b817667c
Item in Clipboard
Multifunctional Nanoparticles as Biocompatible Targeted Probes for Human Cancer Diagnosis and Therapy
J Mater Chem.
.
Abstract
The use of nanoparticles in biological application has been rapidly advancing toward practical applications in human cancer diagnosis and therapy. Upon linking the nanoparticles with biomolecules, they can be used to locate cancerous area as well as for traceable drug delivery with high affinity and specificity. In this review, we discuss the engineering of multifunctional nanoparticle probes and their use in bioimaging and nanomedicine.
Figures

Emission spectra for different sizes of CdSe QDs. The CdSe QDs size decreases as the emission peak blue shifted.

TEM image of CdSe/CdS/ZnS QDs. The size is ~6 nm. The scale bar is 100 nm.

TEM image of InP/ZnS QDs.

TEM image of CdTe/ZnTe QDs

Emission spectra for different sizes of CdTe/ZnTe QDs. The CdTe/ZnTe QDs size increases as the emission peak red shifted.

Size-dependent optical properties of aqueous dispersion of CdTe/ZnTe QDs, demonstrating quantum confinement and size-tunable luminescent emission.

HTREM image of silicon QDs.

TEM image of PbSe QRs. The scale bar is 200 nm.

TEM image of CdS QRs. The scale bar is 100 nm.

TEM image of CdSe/CdS/ZnS QRs. The scale bar is 70 nm.

TEM image of monodispersed SiO2 coated QR nanoparticle. The average size is 40 nm. The scale bar is 100 nm.

Confocal image of macrophage cells treated with SiO2 coated QR particles.

TEM image of gold NRs.

Visible absorption spectra of gold NRs with different aspect ratio.

Scattering image of gold NRs with different aspect ratio.

Confocal images of Panc-1 cells treated with rhodamine-B-conjugated ORMOSIL NPs, without (a) and with (b) bioconjugation with anti-claudin-4.
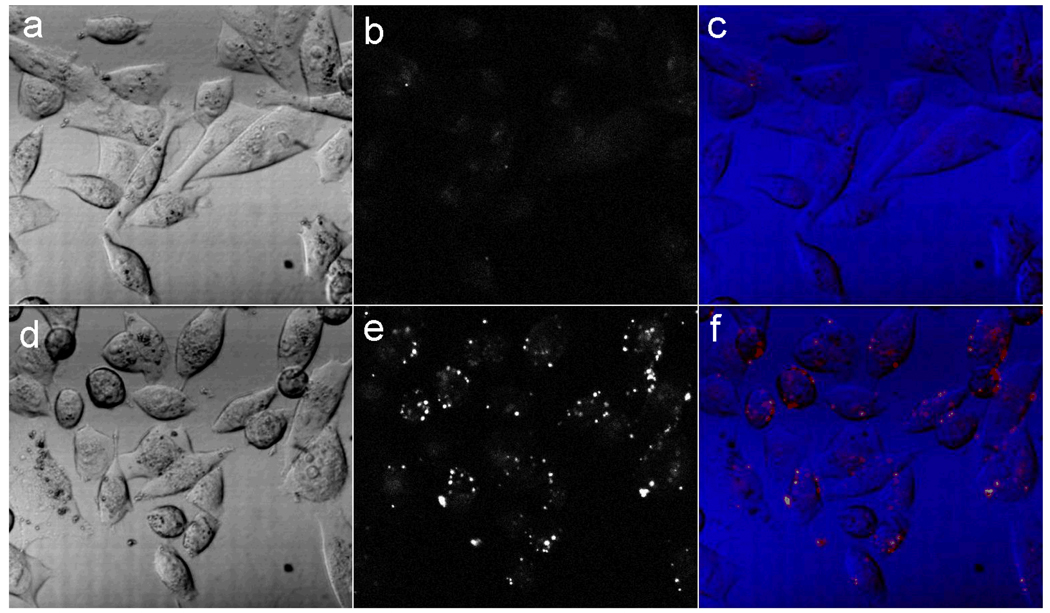
Confocal microscopy images of MiaPaCa cells labeled with unconjugated (lysine-coated) (a, b, and c), and transferrin-conjugated (d, e, and f) CdSe/CdS/ZnS QRs. The images to the left (a and d) show tranmission images. The corresponding fluorescence images are shown in (b) and (e), and overlays of the two are shown in (c) and (f).

Confocal image of pancreatic cancer cells labeled with anti-mesothelin conujugated CdSe/ZnTe QDs (overlay of transmission and fluorescence images).

Confocal image of pancreatic cell lines labeled with CdSe/CdS/ZnS quantum rod bioconjugates.

Cytotoxicity studies of Panc-1, HeLa, and KB cells treated with drug-QRs probe. MTT assays illustrating cell viability upon exposing the cells with different concentration of drug bioconjugates for 24 hours.

in vivo fluorescence image of a mouse treated with phospholipid micelle encapsulated near-IR CdTeSe QDs. The NIR QDs were injected sub-Q under the brain area of the mouse. The red and green colors correspond to the luminescence from the QDs and autofluorescence from the mouse, respectively.

In vivo fluorescence image of a tumor-bearing mouse using anti-claudin-4 conjugated CdSe/CdS/ZnS QRs as early cancer detection probe.

Dark-field scattering images from Panc-1 cells following (a) treatment with anti-mesothelin-conjugated gold NRs and (b) no treatment. The wavelength selective scattering (orange/red) associated with the NRs can be clearly distinguished from the background, and corresponds to the longitudinal surface plasmon oscillation in the red region of the optical spectrum.

TEM images of Panc-1 cells following (a) treatment with anti-mesothelin-conjugated gold NRs and (b) no treatment.
Similar articles
-
Surface engineered multifunctional nano-systems for localised drug delivery against thyroid cancer: A review of current practices.Biomed Pharmacother. 2024 Jul;176:116840. doi: 10.1016/j.biopha.2024.116840. Epub 2024 May 30. Biomed Pharmacother. 2024. PMID: 38820975 Review.
-
Functional surface engineering of C-dots for fluorescent biosensing and in vivo bioimaging.Acc Chem Res. 2014 Jan 21;47(1):20-30. doi: 10.1021/ar400023s. Epub 2013 Aug 2. Acc Chem Res. 2014. PMID: 23911118 Review.
-
Strategies for Preparing Albumin-based Nanoparticles for Multifunctional Bioimaging and Drug Delivery.Theranostics. 2017 Aug 23;7(15):3667-3689. doi: 10.7150/thno.19365. eCollection 2017. Theranostics. 2017. PMID: 29109768 Free PMC article. Review.
-
Advancing Nanomedicine Through Electron Microscopy: Insights Into Nanoparticle Cellular Interactions and Biomedical Applications.Int J Nanomedicine. 2025 Mar 8;20:2847-2878. doi: 10.2147/IJN.S500978. eCollection 2025. Int J Nanomedicine. 2025. PMID: 40078651 Free PMC article. Review.
-
Nanoparticles: functionalization and multifunctional applications in biomedical sciences.Curr Med Chem. 2010;17(36):4559-77. doi: 10.2174/092986710794183024. Curr Med Chem. 2010. PMID: 21062250 Review.
Cited by
-
Current status of biomarker and targeted nanoparticle development: The precision oncology approach for pancreatic cancer therapy.Cancer Lett. 2017 Mar 1;388:139-148. doi: 10.1016/j.canlet.2016.11.030. Epub 2016 Dec 1. Cancer Lett. 2017. PMID: 27916607 Free PMC article.
-
Biomimetic crystallization of sulfide semiconductor nanoparticles in aqueous solution.Small. 2010 May 7;6(9):999-1002. doi: 10.1002/smll.200902121. Small. 2010. PMID: 20461735 Free PMC article. No abstract available.
-
Carboxymethyl chitosan-folic acid-conjugated Fe3O4@SiO2 as a safe and targeting antitumor nanovehicle in vitro.Nanoscale Res Lett. 2014 Mar 25;9(1):146. doi: 10.1186/1556-276X-9-146. Nanoscale Res Lett. 2014. PMID: 24667013 Free PMC article.
-
Alkyl passivation and amphiphilic polymer coating of silicon nanocrystals for diagnostic imaging.Small. 2010 Sep 20;6(18):2026-34. doi: 10.1002/smll.201000825. Small. 2010. PMID: 20818646 Free PMC article.
-
NFL-TBS.40-63 Peptide Gold Complex Nanovector: A Novel Therapeutic Approach to Increase Anticancer Activity by Breakdown of Microtubules in Pancreatic Adenocarcinoma (PDAC).ACS Pharmacol Transl Sci. 2022 Oct 14;5(12):1267-1278. doi: 10.1021/acsptsci.2c00159. eCollection 2022 Dec 9. ACS Pharmacol Transl Sci. 2022. PMID: 36524008 Free PMC article.
References
-
- Azzazy HME, Mansour MMH, Kazmierczak SC. Clinical Biochemistry. 2007;40:917–927. - PubMed
-
- Prasad PN. Nanophotonics. New York: Wiley-Interscience; 2004.
-
- Choi MR, Stanton-Maxey KJ, Stanley JK, Levin CS, Bardhan R, Akin D, Badve S, Sturgis J, Robinson JP, Bashir R, Halas NJ, Clare SE. Nano Lett. 2007;7:3759–3765. - PubMed
-
- Yin Y, Alivisatos AP. Nature. 2005;437:664–670. - PubMed
-
- Prasad PN. Biophotonics. New York: Wiley-Interscience; 2004.
Grants and funding
LinkOut - more resources
Full Text Sources
Other Literature Sources