

Identification of a deubiquitinating enzyme as a novel AGS3-interacting protein
- PMID: 20305814
- PMCID: PMC2840025
- DOI: 10.1371/journal.pone.0009725
Identification of a deubiquitinating enzyme as a novel AGS3-interacting protein
Abstract
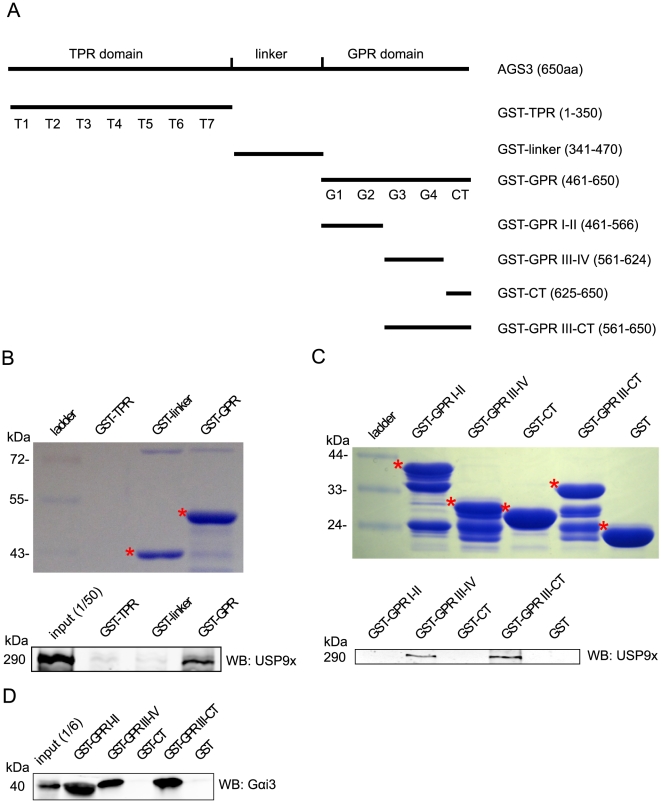
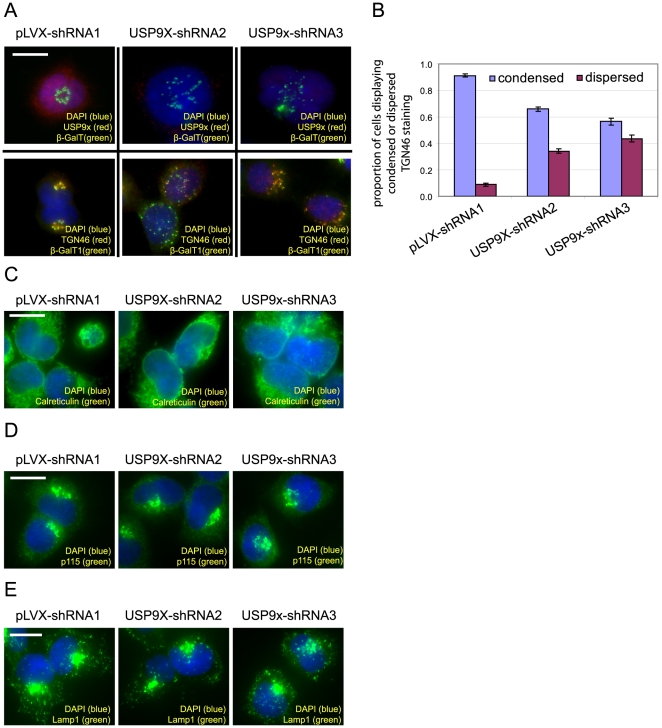
Activator of G protein Signaling 3 (AGS3) is a receptor-independent G protein activator that has been implicated in multiple biological events such as brain development, neuroplasticity and addiction, cardiac function, Golgi structure/function, macroautophagy and metabolism. However, how AGS3 is regulated is little known. We demonstrate here that AGS3 interacts with a ubiquitin specific protease USP9x, and this interaction is at least partially mediated through the C-terminal G protein regulatory domain of AGS3. Knockdown of USP9x causes a moderate reduction in the level of AGS3. In contrast, overexpression of either USP9x or its deubiquitinating domain UCH increases the amount of AGS3, whereas expression of the mutant UCH domain that lacks deubiquitinating activity does not have the same effect. As previously observed in AGS3 knockdown cells, the localization of several marker proteins of the late Golgi compartments is disturbed in cells depleted of USP9x. Taken together, our study suggests that USP9x can modulate the level of a subpopulation of AGS3, and this modulation plays a role in regulating the structure of the late Golgi compartments. Finally, we have found that levels of AGS3 and USP9x are co-regulated in the prefrontal cortex of rats withdrawn from repeated cocaine treatment. In conjunction with the above data, this observation indicates a potential role of USP9X in the regulation of the AGS3 level during cocaine-induced neuroplasticity.
Conflict of interest statement
Figures


Similar articles
-
A specific role of AGS3 in the surface expression of plasma membrane proteins.Proc Natl Acad Sci U S A. 2007 Nov 13;104(46):18103-8. doi: 10.1073/pnas.0709282104. Epub 2007 Nov 8. Proc Natl Acad Sci U S A. 2007. PMID: 17991770 Free PMC article.
-
The PDZ and band 4.1 containing protein Frmpd1 regulates the subcellular location of activator of G-protein signaling 3 and its interaction with G-proteins.J Biol Chem. 2008 Sep 5;283(36):24718-28. doi: 10.1074/jbc.M803497200. Epub 2008 Jun 19. J Biol Chem. 2008. PMID: 18566450 Free PMC article.
-
Translocation of activator of G-protein signaling 3 to the Golgi apparatus in response to receptor activation and its effect on the trans-Golgi network.J Biol Chem. 2013 Aug 16;288(33):24091-103. doi: 10.1074/jbc.M112.444505. Epub 2013 Jun 14. J Biol Chem. 2013. PMID: 23770668 Free PMC article.
-
Deubiquitinase ubiquitin-specific protease 9X regulates the stability and function of E3 ubiquitin ligase ring finger protein 115 in breast cancer cells.Cancer Sci. 2019 Apr;110(4):1268-1278. doi: 10.1111/cas.13953. Epub 2019 Feb 21. Cancer Sci. 2019. PMID: 30689267 Free PMC article.
-
Activators of G-protein signaling 3: a drug addiction molecular gateway.Behav Pharmacol. 2010 Sep;21(5-6):500-13. doi: 10.1097/FBP.0b013e32833dcfa5. Behav Pharmacol. 2010. PMID: 20700046 Free PMC article. Review.
Cited by
-
Disruption of GPSM1/CSF1 signaling reprograms tumor-associated macrophages to overcome anti-PD-1 resistance in colorectal cancer.J Immunother Cancer. 2025 Feb 25;13(2):e010826. doi: 10.1136/jitc-2024-010826. J Immunother Cancer. 2025. PMID: 40010765 Free PMC article.
-
Usp9x regulates Ets-1 ubiquitination and stability to control NRAS expression and tumorigenicity in melanoma.Nat Commun. 2017 Feb 15;8:14449. doi: 10.1038/ncomms14449. Nat Commun. 2017. PMID: 28198367 Free PMC article.
-
WD repeat-containing protein 5 (WDR5) localizes to the midbody and regulates abscission.J Biol Chem. 2015 Apr 3;290(14):8987-9001. doi: 10.1074/jbc.M114.623611. Epub 2015 Feb 9. J Biol Chem. 2015. PMID: 25666610 Free PMC article.
-
Loss of Usp9x disrupts cortical architecture, hippocampal development and TGFβ-mediated axonogenesis.PLoS One. 2013 Jul 5;8(7):e68287. doi: 10.1371/journal.pone.0068287. Print 2013. PLoS One. 2013. PMID: 23861879 Free PMC article.
-
La FAM fatale: USP9X in development and disease.Cell Mol Life Sci. 2015 Jun;72(11):2075-89. doi: 10.1007/s00018-015-1851-0. Epub 2015 Feb 12. Cell Mol Life Sci. 2015. PMID: 25672900 Free PMC article. Review.
References
-
- Takesono A, Cismowski MJ, Ribas C, Bernard M, Chung P, et al. Receptor-independent activators of heterotrimeric G-protein signaling pathways. J Biol Chem. 1999;274:33202–33205. - PubMed
-
- Blumer JB, Chandler LJ, Lanier SM. Expression analysis and subcellular distribution of the two G-protein regulators AGS3 and LGN indicate distinct functionality. Localization of LGN to the midbody during cytokinesis. J Biol Chem. 2002;277:15897–15903. - PubMed
-
- Pattingre S, De Vries L, Bauvy C, Chantret I, Cluzeaud F, et al. The G-protein regulator AGS3 controls an early event during macroautophagy in human intestinal HT-29 cells. J Biol Chem. 2003;278:20995–21002. - PubMed
-
- Blatch GL, Lassle M. The tetratricopeptide repeat: a structural motif mediating protein-protein interactions. Bioessays. 1999;21:932–939. - PubMed
Publication types
MeSH terms
Substances
Grants and funding
LinkOut - more resources
Full Text Sources
Other Literature Sources
Molecular Biology Databases
Research Materials
