. 2010 Nov;40(6):759-67.
doi: 10.1007/s10519-010-9350-4. Epub 2010 Mar 21.

A three-stage genome-wide association study of general cognitive ability: hunting the small effects

Affiliations

A three-stage genome-wide association study of general cognitive ability: hunting the small effects

Oliver S P Davis et al. Behav Genet. 2010 Nov.

Abstract

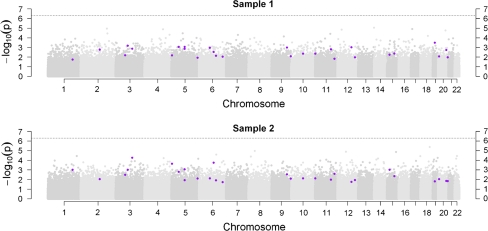
Childhood general cognitive ability (g) is important for a wide range of outcomes in later life, from school achievement to occupational success and life expectancy. Large-scale association studies will be essential in the quest to identify variants that make up the substantial genetic component implicated by quantitative genetic studies. We conducted a three-stage genome-wide association study for general cognitive ability using over 350,000 single nucleotide polymorphisms (SNPs) in the quantitative extremes of a population sample of 7,900 7-year-old children from the UK Twins Early Development Study. Using two DNA pooling stages to enrich true positives, each of around 1,000 children selected from the extremes of the distribution, and a third individual genotyping stage of over 3,000 children to test for quantitative associations across the normal range, we aimed to home in on genes of small effect. Genome-wide results suggested that our approach was successful in enriching true associations and 28 SNPs were taken forward to individual genotyping in an unselected population sample. However, although we found an enrichment of low P values and identified nine SNPs nominally associated with g (P < 0.05) that show interesting characteristics for follow-up, further replication will be necessary to meet rigorous standards of association. These replications may take advantage of SNP sets to overcome limitations of statistical power. Despite our large sample size and three-stage design, the genes associated with childhood g remain tantalizingly beyond our current reach, providing further evidence for the small effect sizes of individual loci. Larger samples, denser arrays and multiple replications will be necessary in the hunt for the genetic variants that influence human cognitive ability.


Figures

Fig. 1
Fig. 1
Genome-wide signal plots. Negative log base 10 P values from a mixed-effects model are plotted against genomic position for samples 1 and 2. Only SNPs associated in the same direction in both samples are displayed. The selected SNPs from Table 1 that were successfully genotyped in the full sample are plotted as darker dots. The dotted line represents P = 5 × 10−7. Chromosome-by-chromosome signal plots are presented in supplementary materials
Fig. 2
Fig. 2
Quantile–quantile plots for samples 1 and 2. In each panel negative log base 10 P values from a mixed-effects model are plotted against theoretical quantiles from the null distribution. The straight line at x = y represents the null distribution and the gray areas represent 95% bootstrapped confidence intervals on the null. The left-hand plot represents genome-wide SNPs passing quality control in sample 1; the right-hand plot represents the top 3,000 SNPs from sample 1 tested in sample 2 (one-tailed). Although the left-hand plot shows no associations greater than chance, the right-hand plot shows that the SNPs tested in the second sample are enriched for associations; this can be seen by the deviation of the SNPs from the x = y line. The best-performing SNPs from this second stage were individually genotyped in a large sample of TEDS individuals across the distribution of g and tested for quantitative association; the results are presented in Table 1
Fig. 3
Fig. 3
A SNP set for g at 7 years of age. The SNP set is formed from the nominally associated SNPs from Table 1 by counting the number of alleles associated with high g in each individual. Because rs10997145 is significantly non-additive, it was scored 0, 2 and 2 instead. The points represent mean g scores and the line represents the regression of the g score on the SNP set score. The underlying bar chart shows the number of individuals with each SNP set score. The graph runs from 6 to 16 rather than from 0 to 18, because there were no individuals with SNP set scores of 0 to 5 or 17 to 18
Fig. 4
Fig. 4
Signal plot for the region surrounding rs10997145 on Chromosome 10. The top panel shows negative log base 10 P values from a mixed-effects model in Sample 1 plotted against physical position; the darker dot represents the target SNP. The second panel shows the same for Sample 2. The third panel shows genes downloaded from Ensembl (release 49; http://mar2008.archive.ensembl.org/index.html), plus and minus strands. The bottom panel shows recombination rate in cM per Mb (darker line and left axis) and genetic distance from the target SNP in cM (lighter line and right axis), both extracted from HapMap CEPH data. Regional signal plots for all the SNPs in Table 1 are presented in supplementary materials

References

    1. Balding DJ. A tutorial on statistical methods for population association studies. Nat Rev Genet. 2006;7(10):781–791. doi: 10.1038/nrg1916. - DOI - PubMed
    1. Barratt BJ, Payne F, Rance HE, Nutland S, Todd JA, Clayton DG. Identification of the sources of error in allele frequency estimations from pooled DNA indicates an optimal experimental design. Annu Hum Genet. 2002;66:393–405. doi: 10.1046/j.1469-1809.2002.00125.x. - DOI - PubMed
    1. Benjamini Y, Hochberg Y. Controlling the false discovery rate: a practical and powerful approach to multiple testing. J R Stat Soc B. 1995;57:289–300.
    1. Berezikov E, Thuemmler F, van Laake LW, Kondova I, Bontrop R, Cuppen E, Plasterk RH. Diversity of microRNAs in human and chimpanzee brain. Nat Genet. 2006;38:1375–1377. doi: 10.1038/ng1914. - DOI - PubMed
    1. Bertram L, Mullin K, Parkinson M, Hsiao M, Moscarillo TJ, Wagner SL, Becker KD, Velicelebi G, Blacker D, Tanzi RE. Is a-T catenin (VR22) an Alzheimer’s disease risk gene? Br Med J. 2007;44:63. - PMC - PubMed

Publication types

LinkOut - more resources