

Environmental distribution of prokaryotic taxa
- PMID: 20307274
- PMCID: PMC2850351
- DOI: 10.1186/1471-2180-10-85
Environmental distribution of prokaryotic taxa
Abstract
Background: The increasing availability of gene sequences of prokaryotic species in samples extracted from all kind of locations allows addressing the study of the influence of environmental patterns in prokaryotic biodiversity. We present a comprehensive study to address the potential existence of environmental preferences of prokaryotic taxa and the commonness of the specialist and generalist strategies. We also assessed the most significant environmental factors shaping the environmental distribution of taxa.
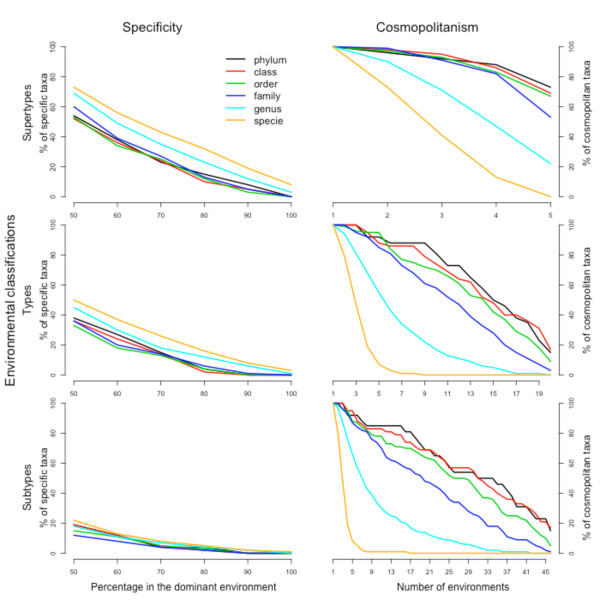
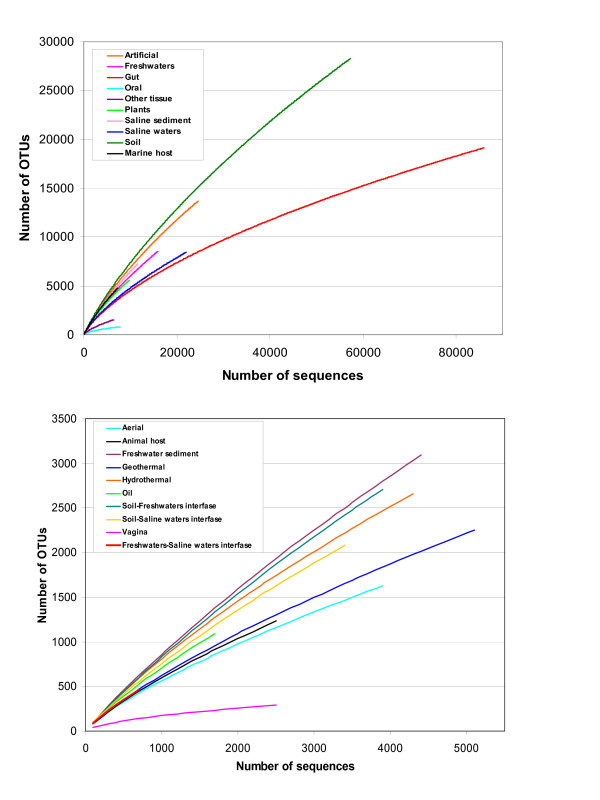
Results: We used 16S rDNA sequences from 3,502 sampling experiments in natural and artificial sources. These sequences were taxonomically assigned, and the corresponding samples were also classified into a hierarchical classification of environments. We used several statistical methods to analyze the environmental distribution of taxa. Our results indicate that environmental specificity is not very common at the higher taxonomic levels (phylum to family), but emerges at lower taxonomic levels (genus and species). The most selective environmental characteristics are those of animal tissues and thermal locations. Salinity is another very important factor for constraining prokaryotic diversity. On the other hand, soil and freshwater habitats are the less restrictive environments, harboring the largest number of prokaryotic taxa. All information on taxa, samples and environments is provided at the envDB online database, http://metagenomics.uv.es/envDB.
Conclusions: This is, as far as we know, the most comprehensive assessment of the distribution and diversity of prokaryotic taxa and their associations with different environments. Our data indicate that we are still far from characterizing prokaryotic diversity in any environment, except, perhaps, for human tissues such as the oral cavity and the vagina.
Figures


Similar articles
-
EnvDB, a database for describing the environmental distribution of prokaryotic taxa.Environ Microbiol Rep. 2009 Jun;1(3):191-7. doi: 10.1111/j.1758-2229.2009.00030.x. Epub 2009 Apr 29. Environ Microbiol Rep. 2009. PMID: 23765793
-
Distribution of prokaryotic genetic diversity in athalassohaline lakes of the Atacama Desert, Northern Chile.FEMS Microbiol Ecol. 2004 Apr 1;48(1):57-69. doi: 10.1016/j.femsec.2003.12.013. FEMS Microbiol Ecol. 2004. PMID: 19712431
-
Capabilities and limitations of DGGE for the analysis of hydrocarbonoclastic prokaryotic communities directly in environmental samples.Microbiologyopen. 2017 Oct;6(5):e00495. doi: 10.1002/mbo3.495. Epub 2017 May 18. Microbiologyopen. 2017. PMID: 28516483 Free PMC article.
-
Review and re-analysis of domain-specific 16S primers.J Microbiol Methods. 2003 Dec;55(3):541-55. doi: 10.1016/j.mimet.2003.08.009. J Microbiol Methods. 2003. PMID: 14607398 Review.
-
The ecological coherence of high bacterial taxonomic ranks.Nat Rev Microbiol. 2010 Jul;8(7):523-9. doi: 10.1038/nrmicro2367. Nat Rev Microbiol. 2010. PMID: 20531276 Review.
Cited by
-
Bacterial community structure across environmental gradients in permafrost thaw ponds: methanotroph-rich ecosystems.Front Microbiol. 2015 Mar 18;6:192. doi: 10.3389/fmicb.2015.00192. eCollection 2015. Front Microbiol. 2015. PMID: 25926816 Free PMC article.
-
Contrasting patterns of the bacterial and archaeal communities in a high-elevation river in northwestern China.J Microbiol. 2018 Feb;56(2):104-112. doi: 10.1007/s12275-018-7244-y. Epub 2018 Feb 2. J Microbiol. 2018. PMID: 29392556
-
Bacteria dialog with Santa Rosalia: Are aggregations of cosmopolitan bacteria mainly explained by habitat filtering or by ecological interactions?BMC Microbiol. 2014 Dec 4;14:284. doi: 10.1186/s12866-014-0284-5. BMC Microbiol. 2014. PMID: 25472003 Free PMC article.
-
Prokaryotic assemblages in the maritime Antarctic Lake Limnopolar (Byers Peninsula, South Shetland Islands).Extremophiles. 2017 Nov;21(6):947-961. doi: 10.1007/s00792-017-0955-x. Epub 2017 Sep 21. Extremophiles. 2017. PMID: 28936677
-
Meta-16S rRNA Gene Phylogenetic Reconstruction Reveals the Astonishing Diversity of Cosmopolitan Myxobacteria.Microorganisms. 2019 Nov 11;7(11):551. doi: 10.3390/microorganisms7110551. Microorganisms. 2019. PMID: 31717918 Free PMC article.
