

Up- and down-modulation of liver cytochrome P450 activities and associated events in two murine malaria models
- PMID: 20307316
- PMCID: PMC2858213
- DOI: 10.1186/1475-2875-9-81
Up- and down-modulation of liver cytochrome P450 activities and associated events in two murine malaria models
Abstract
Background: The mechanisms by which malaria up and down-regulates CYP activities are not understood yet. It is also unclear whether CYP activities are modulated during non-lethal malaria infections. This study was undertaken to evaluate the time course of CYP alterations in lethal (Plasmodium berghei ANKA) and non-lethal (Plasmodium chabaudi chabaudi) murine malaria. Additionally, hypotheses on the association of CYP depression with enhanced nitric oxide (NO) production, and of CYP2a5 induction with endoplasmic reticulum dysfunction, enhanced haem metabolism and oxidative stress were examined as well.
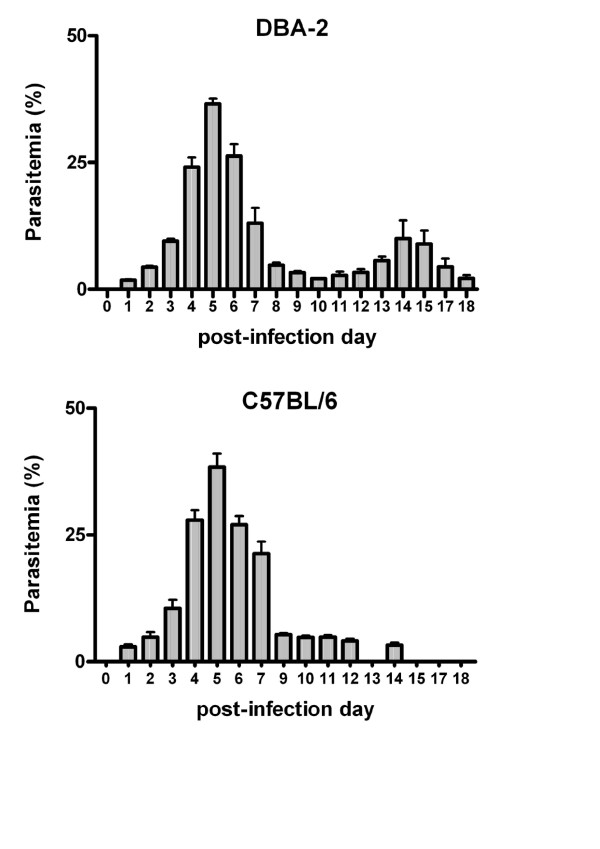
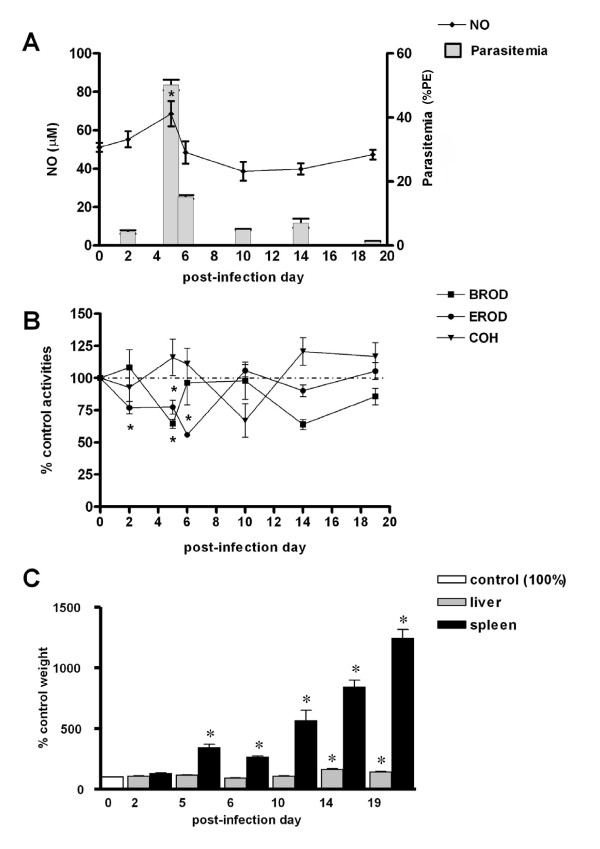
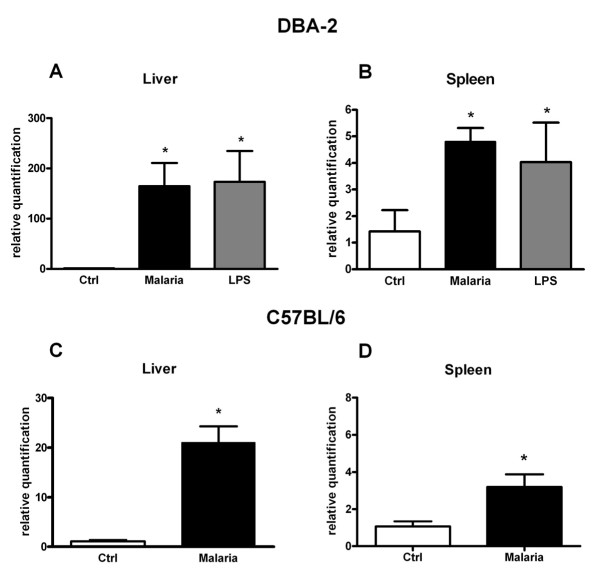
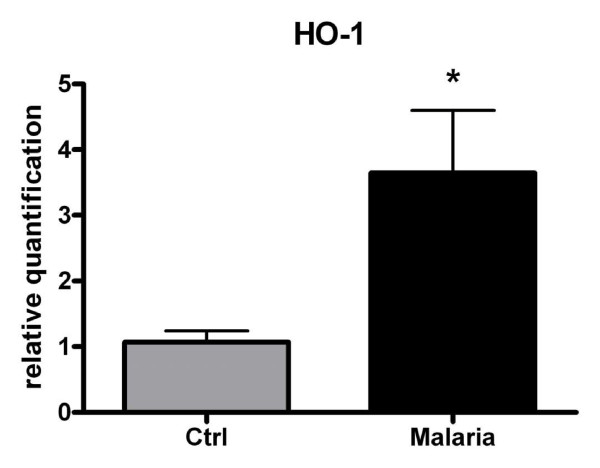
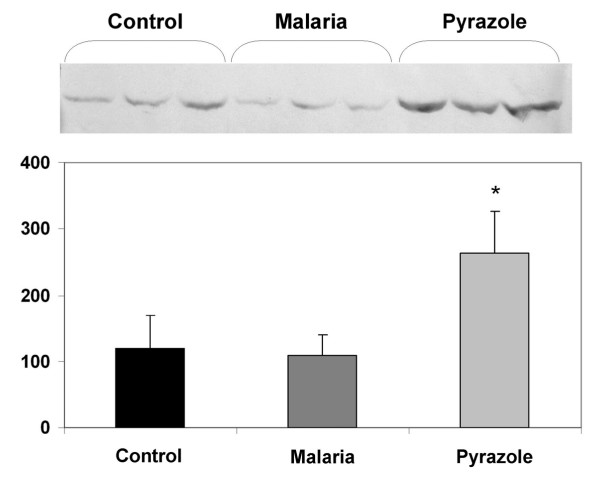
Methods: Female DBA-2 and C57BL/6 mice were infected with P.berghei ANKA or P. chabaudi and killed at different post-infection days. Infection was monitored by parasitaemia rates and clinical signs. NO levels were measured in the serum. Activities of CYP1a (ethoxyresorufin-O-deethylase), 2b (benzyloxyresorufin-O-debenzylase), 2a5 (coumarin-7-hydroxylase) and uridine-diphosphoglucuronyl-transferase (UGT) were determined in liver microsomes. Glutathione-S-transferase (GST) activity and concentrations of gluthatione (GSH) and thiobarbituric acid-reactive substances (TBARS) were determined in the liver. Levels of glucose-regulated protein 78 (GRP78) were evaluated by immunoblotting, while mRNAs of haemoxygenase-1 (HO-1) and inducible nitric oxide synthase (iNOS) were determined by quantitative RT-PCR.
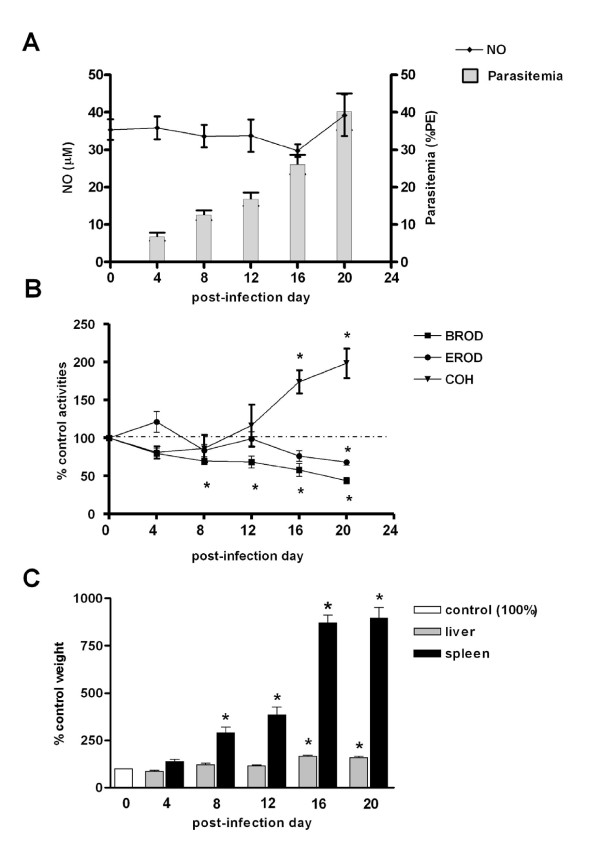
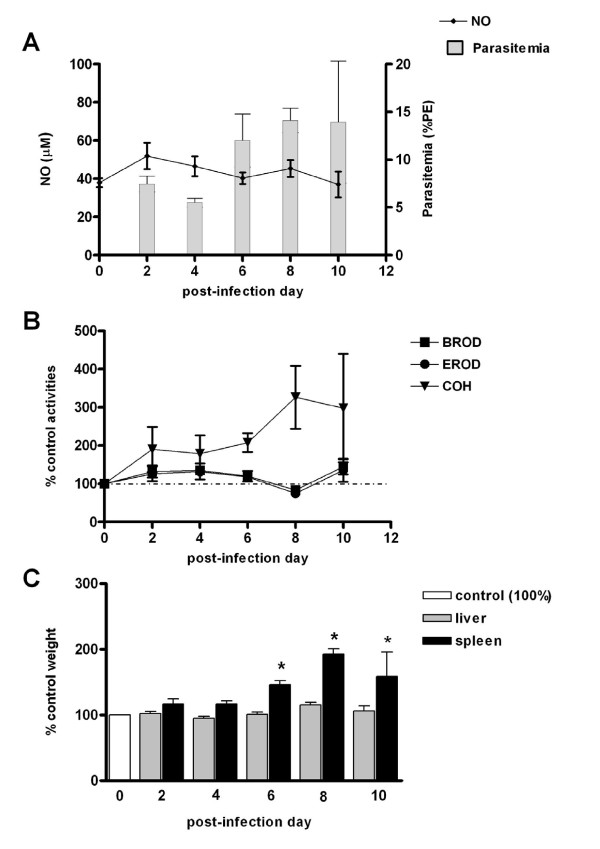
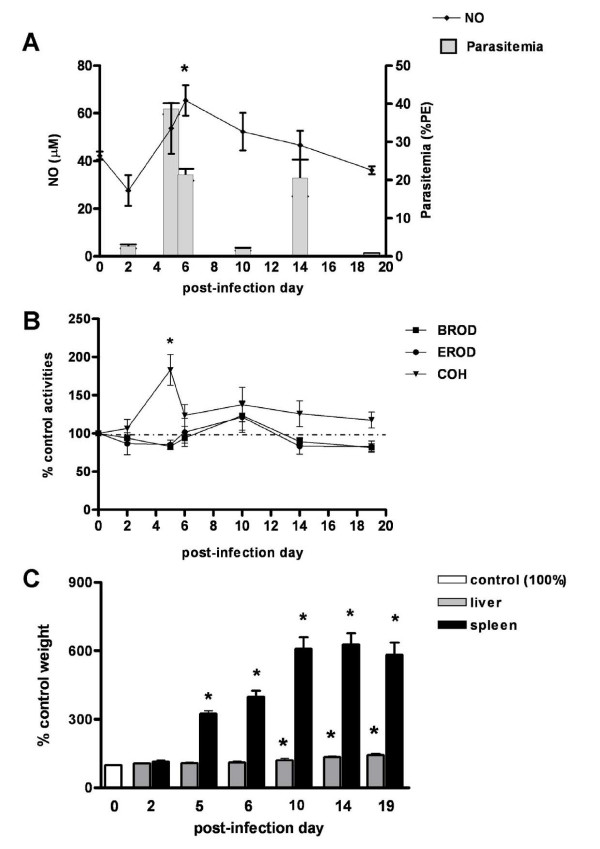
Results: Plasmodium berghei depressed CYP1a and 2b and induced 2a5 in DBA-2 mice. In P.berghei-infected C57BL/6 mice CYP activities remained unaltered. In both strains, GST and UGT were not affected by P.berghei. Plasmodium c. chabaudi depressed CYP1a and 2b and induced 2a5 activities on the day of peak parasitaemia or near this day. CYP2a5 induction was associated with over-expression of HO-1 and enhanced oxidative stress, but it was not associated with GRP78 induction, a marker of endoplasmic reticulum stress. Plasmodium chabaudi increased serum NO on days near the parasitaemia peak in both strains. Although not elevating serum NO, P.berghei enhanced iNOS mRNA expression in the liver.
Conclusion: Down-regulation of CYP1a and 2b and induction of 2a5 occurred in lethal and non-lethal infections when parasitaemia rates were high. A contribution of NO for depression of CYP2b cannot be ruled out. Results were consistent with the view that CYP2a5 and HO-1 are concurrently up-regulated and suggested that CYP2a5 induction may occur in the absence of enhanced endoplasmic reticulum stress.
Figures
Similar articles
-
Plasmodium berghei (ANKA): infection induces CYP2A5 and 2E1 while depressing other CYP isoforms in the mouse liver.Exp Parasitol. 2006 Aug;113(4):256-61. doi: 10.1016/j.exppara.2006.01.013. Epub 2006 Mar 15. Exp Parasitol. 2006. PMID: 16540109
-
Expression of inducible nitric oxide synthase (iNOS) mRNA in target organs of lethal and non-lethal strains of murine malaria.Parasite Immunol. 2002 Sep-Oct;24(9-10):471-8. doi: 10.1046/j.1365-3024.2002.00490.x. Parasite Immunol. 2002. PMID: 12654089
-
Differential induction of malaria liver pathology in mice infected with Plasmodium chabaudi AS or Plasmodium berghei NK65.Malar J. 2018 Jan 9;17(1):18. doi: 10.1186/s12936-017-2159-3. Malar J. 2018. PMID: 29316914 Free PMC article.
-
Mouse models of blood-stage malaria infections: immune responses and cytokines involved in protection and pathology.Chem Immunol. 2002;80:204-28. doi: 10.1159/000058845. Chem Immunol. 2002. PMID: 12058640 Review. No abstract available.
-
Malaria-induced Alterations of Drug Kinetics and Metabolism in Rodents and Humans.Curr Drug Metab. 2021;22(2):127-138. doi: 10.2174/1389200221999210101232057. Curr Drug Metab. 2021. PMID: 33397251 Review.
Cited by
-
Genome-wide liver transcriptomic profiling of a malaria mouse model reveals disturbed immune and metabolic responses.Parasit Vectors. 2023 Jan 30;16(1):40. doi: 10.1186/s13071-023-05672-w. Parasit Vectors. 2023. PMID: 36717945 Free PMC article.
-
Impact of visceral leishmaniasis and curative chemotherapy on cytochrome P450 activity in Brazilian patients.Br J Clin Pharmacol. 2015 Nov;80(5):1160-8. doi: 10.1111/bcp.12677. Epub 2015 Jul 2. Br J Clin Pharmacol. 2015. PMID: 25940755 Free PMC article. Clinical Trial.
-
A non-lethal malarial infection results in reduced drug metabolizing enzyme expression and drug clearance in mice.Malar J. 2019 Jul 12;18(1):234. doi: 10.1186/s12936-019-2860-5. Malar J. 2019. PMID: 31299982 Free PMC article.
-
Hepatic cytochrome P450s, phase II enzymes and nuclear receptors are downregulated in a Th2 environment during Schistosoma mansoni infection.Drug Metab Dispos. 2014 Jan;42(1):134-40. doi: 10.1124/dmd.113.054957. Epub 2013 Oct 25. Drug Metab Dispos. 2014. PMID: 24163175 Free PMC article.
-
Efficacy, Safety, Tolerability, and Pharmacokinetics of MMV390048 in Acute Uncomplicated Malaria.Am J Trop Med Hyg. 2022 Dec 5;108(1):81-84. doi: 10.4269/ajtmh.22-0567. Print 2023 Jan 11. Am J Trop Med Hyg. 2022. PMID: 36509063 Free PMC article. Clinical Trial.
References
-
- Morgan ET. Regulation of cytochrome P450 by inflammatory mediators: why and how? Drug Metab Dispos. 2001;29:207–212. - PubMed
-
- Uhl K, Grace JM, Kocisko DA, Jennings BT, Michell AL, Brewer TG. Effects of Plasmodium berghei infection on cytochromes P-450 2E1 and 3A2. Eur J Drug Metab Pharmacokinet. 1999;24:169–176. - PubMed
-
- Poça KS, De-Oliveira AC, Santos MJ, Paumgartten FJ. Malaria infection modulates effects of genotoxic chemicals in the mouse bone-marrow micronucleus test. Mutat Res. 2008;649:28–33. - PubMed
Publication types
MeSH terms
Substances
LinkOut - more resources
Full Text Sources
Medical
Research Materials
Miscellaneous
