

Characterization of cardiovascular outcomes in a type 2 diabetes glucose supply and insulin demand model
- PMID: 20307400
- PMCID: PMC2864175
- DOI: 10.1177/193229681000400220
Characterization of cardiovascular outcomes in a type 2 diabetes glucose supply and insulin demand model
Abstract
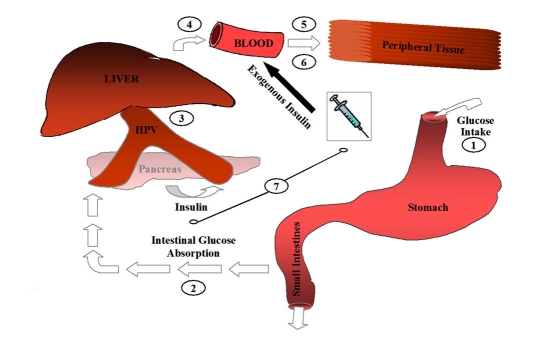
Background: The nonsignificant reduction in macrovascular outcomes observed in Action to Control Cardiovascular Risk in Diabetes; Action in Diabetes and Vascular Disease: Preterax and Diamicron Modified Release Controlled Evaluation; and the Veterans Affairs Diabetes Trial have collectively created uncertainty with respect toward the proper extent of blood glucose reduction and also the optimal therapeutic choice to attain the reduction. In the article entitled "Glucose Supply and Insulin Demand Dynamics of Antidiabetic Agents" in this issue of Journal of Diabetes Science and Technology, we presented data for a pharmacokinetic/pharmacodynamic model that characterizes the effect of conventional antidiabetic therapies on the glucose supply and insulin demand dynamic. Here, it is our objective to test the hypothesis that, in conjunction with hemoglobin A1c (HbA1c), patients managed on the glucose supply side of the model would have fewer cardiovascular events versus those managed on the insulin demand side.
Methods: To test this hypothesis, the electronic medical records of a group model health maintenance organization were queried to compile a population of patients meeting the following inclusion criteria: (1) type 2 diabetes mellitus (T2DM), (2) known date of T2DM diagnosis; (3) ICD-9 or CPT code identification and chart review confirmation of a first major cardiovascular event (myocardial infarction, coronary artery bypass graft, or angioplasty),(4) five years of continuous eligibility, and (5) on antidiabetic therapy at the beginning of the 5-year observation period. These patients were subsequently matched (1:1) to T2DM patients meeting the same criteria who had not experienced an event and were analyzed for differences in glucose control (HbA1C), the glucose supply:insulin demand dynamic (SD ratio), and categorical combinations of both parameters.
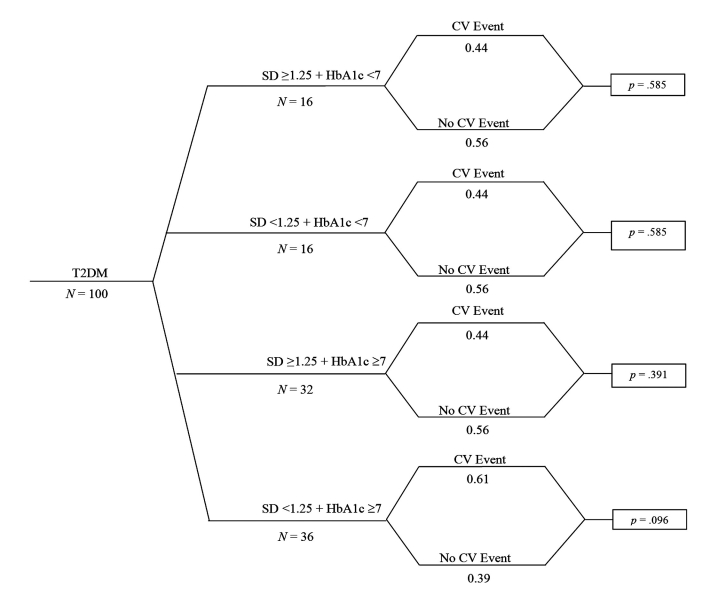
Results: Fifty cardiovascular event patients met inclusion criteria and were matched to controls. No difference was observed for the average HbA1c or SD ratio between patients experiencing an event and controls (7.5 +/- 1.0% versus 7.3 +/- 0.9%, p = .275, and 1.2 +/- 0.3 versus 1.3 +/- 0.3, p = .205, respectively). Likewise, for categorical representations, there were no differences in event rate at the pre-identified breakpoints (HbA1c >or=7% versus <7%; 72% versus 64%, p = .391, and SD ratio >or=1 versus <1; 68% versus 76%, p = .373, >or=1.25 versus <1.25; 42% versus 56%, p = .161, >or=1.5 versus <1.5; 22% versus 30%, p = .362, respectively). Analyzing the combined effect of glucose control and the SD dynamic, patients managed at higher glucose values and on the insulin demand side of the model (HbA1c >or=7% and SD ratio <1.25) tended to have greater cardiovascular risk than those managed at an HbA1c <7%, or HbA1c >or=7% with an SD ratio >or=1.25 (61% versus 39%; p = .096).
Conclusion: Independently, more aggressive HbA1c reduction and higher SD ratio values were not independently associated with a reduction in cardiovascular outcomes. Combining the parameters, it would appear that patients managed at higher glucose values and on the insulin demand side of the model may have increased cardiovascular risk. Based on these findings, it is pertinent to conduct subsequent works to refine SD ratio estimates and apply the model to larger, long-term T2DM cardiovascular outcome trials. J Diabetes Sci Technol 2010;4(2):382-390.
(c) 2010 Diabetes Technology Society.
Figures
Similar articles
-
Glucose supply and insulin demand dynamics of antidiabetic agents.J Diabetes Sci Technol. 2010 Mar 1;4(2):365-81. doi: 10.1177/193229681000400219. J Diabetes Sci Technol. 2010. PMID: 20307399 Free PMC article.
-
Veterans Affairs Cooperative Study on glycemic control and complications in type II diabetes (VA CSDM). Results of the feasibility trial. Veterans Affairs Cooperative Study in Type II Diabetes.Diabetes Care. 1995 Aug;18(8):1113-23. doi: 10.2337/diacare.18.8.1113. Diabetes Care. 1995. PMID: 7587846 Clinical Trial.
-
Baseline and 1-year interim follow-up assessment of Japanese patients initiating insulin therapy who were enrolled in the cardiovascular risk evaluation in people with type 2 diabetes on insulin therapy study: an international, multicenter, observational study.Cardiovasc Diabetol. 2013 Sep 8;12:131. doi: 10.1186/1475-2840-12-131. Cardiovasc Diabetol. 2013. PMID: 24011395 Free PMC article.
-
What matters in ADVANCE and ADVANCE-ON.Diabetes Obes Metab. 2012 Jan;14 Suppl 1:20-9. doi: 10.1111/j.1463-1326.2011.01509.x. Diabetes Obes Metab. 2012. PMID: 22118707 Review.
-
Glycaemic control and macrovascular and microvascular outcomes: A systematic review and meta-analysis of trials investigating intensive glucose-lowering strategies in people with type 2 diabetes.Diabetes Obes Metab. 2024 Jun;26(6):2069-2081. doi: 10.1111/dom.15511. Epub 2024 Feb 26. Diabetes Obes Metab. 2024. PMID: 38409644
References
-
- Action to Control Cardiovascular Risk in Diabetes Study Group. Gerstein HC, Miller ME, Byington RP, Goff DC, Jr, Bigger JT, Buse JB, Cushman WC, Genuth S, Ismail-Beigi F, Grimm RH, Jr, Probstfield JL, Simons-Morton DG, Friedewald WT. Effects of intensive glucose lowering in type 2 diabetes. N Engl J Med. 2008;358(24):2545–2559. - PMC - PubMed
-
- ADVANCE Collaborative Group. Patel A, MacMahon S, Chalmers J, Neal B, Billot L, Woodward M, Marre M, Cooper M, Glasziou P, Grobbee D, Hamet P, Harrap S, Heller S, Liu L, Mancia G, Mogensen CE, Pan C, Poulter N, Rodgers A, Williams B, Bompoint S, de Galan BE, Joshi R, Travert F. Intensive blood glucose control and vascular outcomes in patients with type 2 diabetes. N Engl J Med. 2008;358(24):2560–2572. - PubMed
-
- Duckworth W, Abraira C, Moritz T, Reda D, Emanuele N, Reaven PD, Zieve FJ, Marks J, Davis SN, Hayward R, Warren SR, Goldman S, McCarren M, Vitek ME, Henderson WG, Huang GD. VADT Investigators. Glucose control and vascular complications in veterans with type 2 diabetes. N Engl J Med. 2009;360(2):129–139. - PubMed
-
- Newton KM, Wagner EH, Ramsey SD, McCulloch D, Evans R, Sandhu N, Davis C. The use of automated data to identify complications and comorbidities of diabetes: a validation study. J Clin Epidemiol. 1999;52(3):199–207. - PubMed
MeSH terms
Substances
LinkOut - more resources
Full Text Sources
Other Literature Sources
Medical
Miscellaneous
