

doi: 10.1177/193229681000400222.
Continuous glucose monitoring: real-time algorithms for calibration, filtering, and alarms
Affiliations
- PMID: 20307402
- PMCID: PMC2864177
- DOI: 10.1177/193229681000400222
Item in Clipboard
Continuous glucose monitoring: real-time algorithms for calibration, filtering, and alarms
J Diabetes Sci Technol.
.
Abstract
Algorithms for real-time use in continuous glucose monitors are reviewed, including calibration, filtering of noisy signals, glucose predictions for hypoglycemic and hyperglycemic alarms, compensation for capillary blood glucose to sensor time lags, and fault detection for sensor degradation and dropouts. A tutorial on Kalman filtering for real-time estimation, prediction, and lag compensation is presented and demonstrated via simulation examples. A limited number of fault detection methods for signal degradation and dropout have been published, making that an important area for future work.
(c) 2010 Diabetes Technology Society.
Figures
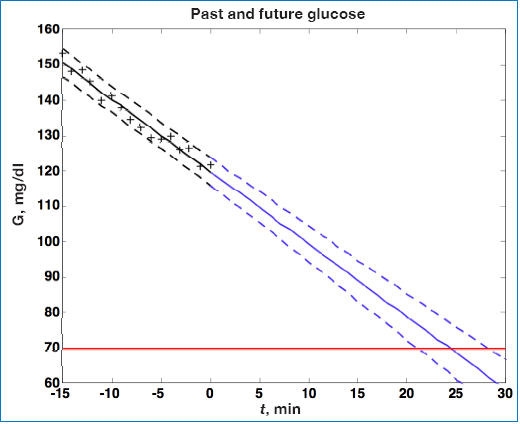
Continuous glucose (G) measurements are plotted as (+) from t = −15 to t = 0 minute. Linear regression is used to fit data to the solid line, retrospectively, from t = −15 to 0 minute. Dashed lines represent ±95% confidence intervals. Note that confidence intervals grow for predictions from t = 0 to t = 30 minutes into the future.
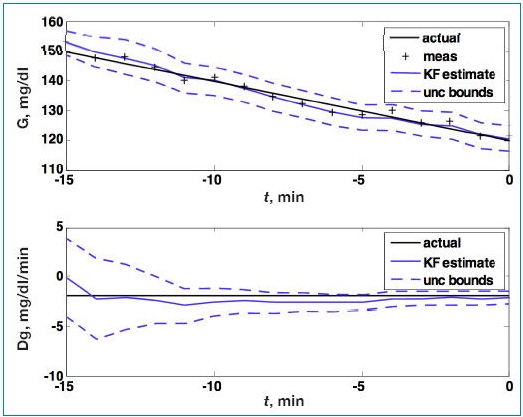
Glucose (G; top) and rate of change of glucose (Dg; bottom). Actual (black), Kalman filter (KF) estimate (blue), and uncertainty (unc) bounds (- - -). The Kalman filter was initialized at t = −15 minutes, with uncertainty in the glucose and rate-of-change states. The estimated error variance improves with measurement (meas) updates. Q = 0.01, R = 4.
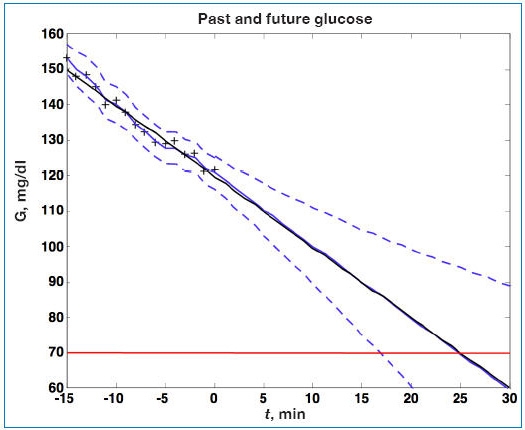
Actual glucose (G; black), measured (+), estimated (blue), and uncertainty bounds (- -). The Kalman filter was initialized at t = −15 minutes. After t = 0 the estimated error variance grows as there are no measurements to improve the estimates.
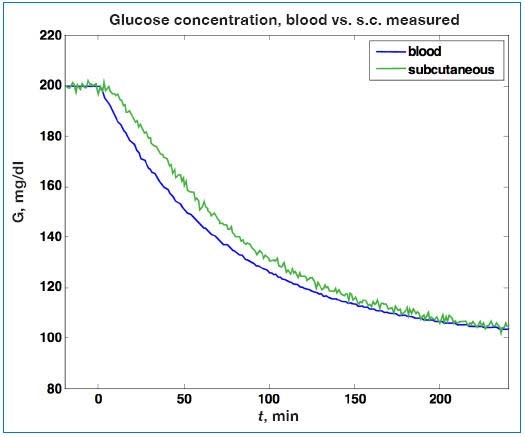
Simulated change in capillary blood glucose (G) and the corresponding interstitial fluid sensor signal. A lag of 12 minutes between capillary blood and interstitial fluid is assumed, and sensor noise with a standard deviation of 1 mg/dl is used. s.c., subcutaneous.
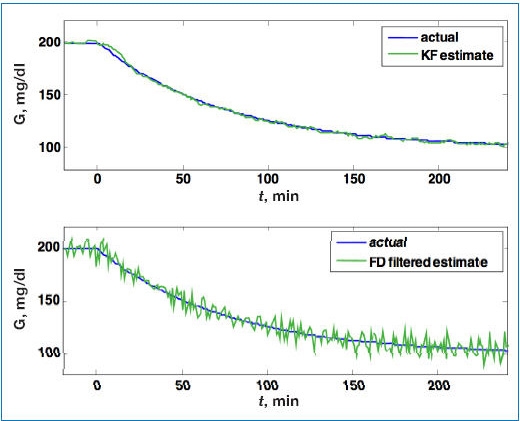
Comparison of estimated blood glucose (G) from a Kalman filter (KF; top), with the FD estimator (bottom), based on the simulated sensor signal in Figure 4. While there is a slight lag immediately after the initial decrease in blood glucose using the Kalman filter, much less noise propagates into the estimate compared to the FD approach.
References
-
- Bequette BW. A critical assessment of algorithms and challenges in the development of an artificial pancreas. Diabetes Technol Ther. 2005;7(1):28–47. - PubMed
-
- Doyle FJ, 3rd, Jovanovic L, Seborg DE. A tutorial on biomedical process control: glucose control strategies for treating type 1 diabetes mellitus. J Process Control. 2007;17(7):572–576.
-
- Kumareswaran K, Evans ML, Hovorka R. Artificial pancreas: an emerging approach to treat type 1 diabetes. Expert Rev Med Dev. 2009;6(4):401–410. - PubMed
-
- Klonoff DC. Continuous glucose monitoring: roadmap for 21st century diabetes therapy. Diabetes Care. 2005;28(5):1231–1239. - PubMed
Publication types
MeSH terms
Substances
LinkOut - more resources
Full Text Sources
Other Literature Sources
Medical
