

Airborne endotoxin concentrations in homes burning biomass fuel
- PMID: 20308032
- PMCID: PMC2920920
- DOI: 10.1289/ehp.0901605
Airborne endotoxin concentrations in homes burning biomass fuel
Abstract
Background: About half of the world's population is exposed to smoke from burning biomass fuels at home. The high airborne particulate levels in these homes and the health burden of exposure to this smoke are well described. Burning unprocessed biological material such as wood and dried animal dung may also produce high indoor endotoxin concentrations.
Objective: In this study we measured airborne endotoxin levels in homes burning different biomass fuels.
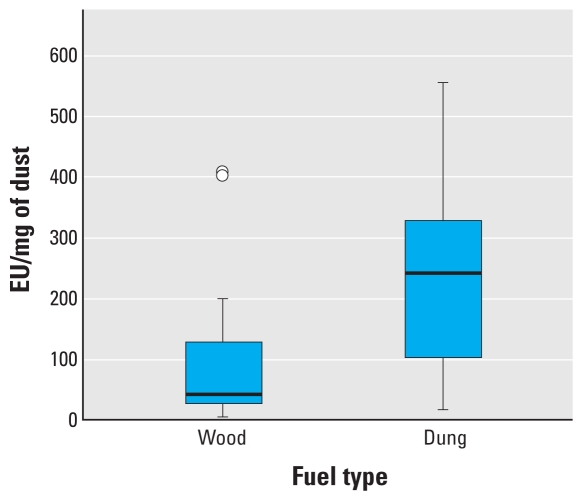
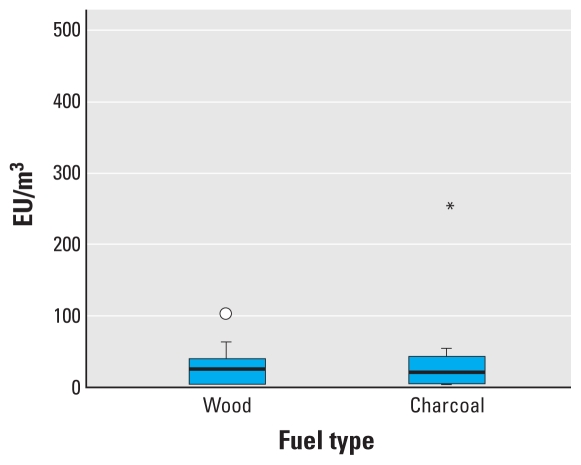
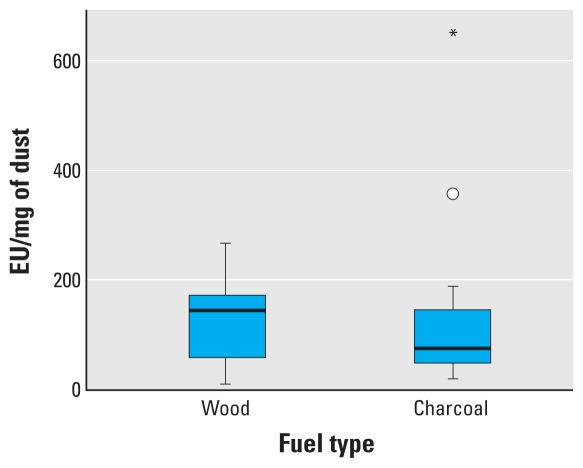
Methods: Air sampling was carried out in homes burning wood or dried animal dung in Nepal (n = 31) and wood, charcoal, or crop residues in Malawi (n = 38). Filters were analyzed for endotoxin content expressed as airborne endotoxin concentration and endotoxin per mass of airborne particulate.
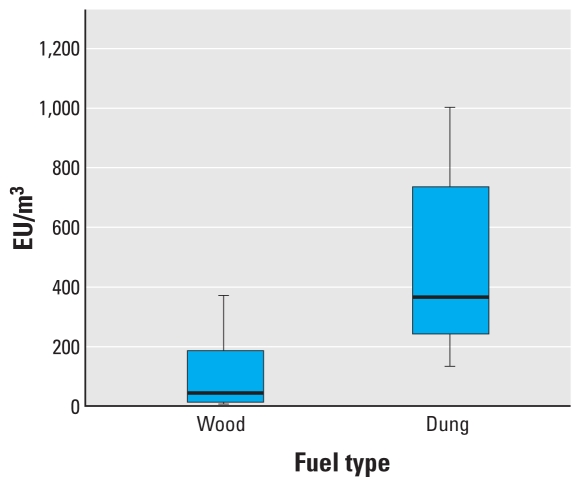
Results: Airborne endotoxin concentrations were high. Averaged over 24 hr in Malawian homes, median concentrations of total inhalable endotoxin were 24 endotoxin units (EU)/m(3) in charcoal-burning homes and 40 EU/m(3) in wood-burning homes. Short cooking-time samples collected in Nepal produced median values of 43 EU/m(3) in wood-burning homes and 365 EU/m(3) in dung-burning homes, suggesting increasing endotoxin levels with decreasing energy levels in unprocessed solid fuels.
Conclusions: Airborne endotoxin concentrations in homes burning biomass fuels are orders of magnitude higher than those found in homes in developed countries where endotoxin exposure has been linked to respiratory illness in children. There is a need for work to identify the determinants of these high concentrations, interventions to reduce exposure, and health studies to examine the effects of these sustained, near-occupational levels of exposure experienced from early life.
Figures
Comment in
-
Endotoxin from biomass burning: an underestimated health hazard?Environ Health Perspect. 2010 Jul;118(7):A304. doi: 10.1289/ehp.118-a304b. Environ Health Perspect. 2010. PMID: 20601319 Free PMC article. No abstract available.
References
-
- Albalak R, Bruce N, McCracken JP, Smith KR, De Gallardo T. Indoor respirable particulate matter concentrations from an open fire, improved cookstove, and LPG/open fire combination in a rural Guatemalan community. Environ Sci Technol. 2001;35:2650–2655. - PubMed
-
- Chen Q, Hildemann LM. The effects of human activities on exposure to particulate matter and bioaerosols in residential homes. Environ Sci Technol. 2009;43:4641–4646. - PubMed
-
- Douwes J, Thorne PS, Pearce N, Heederik D. Bioaerosol health effects and exposure assessment: progress and prospects. Ann Occup Hyg. 2003;47:187–200. - PubMed
-
- Edwards RD, Liu Y, He G, Yin Z, Sinton J, Peabody J, et al. Household CO and PM measured as part of a review of China’s National Improved Stove Program. Indoor Air. 2007;17:189–203. - PubMed
Publication types
MeSH terms
Substances
Grants and funding
LinkOut - more resources
Full Text Sources
Medical
