. 2010 May 21;285(21):15794-804.
doi: 10.1074/jbc.M109.074534. Epub 2010 Mar 22.

Mast cell-derived prostaglandin D2 controls hyaluronan synthesis in human orbital fibroblasts via DP1 activation: implications for thyroid eye disease

Affiliations

Mast cell-derived prostaglandin D2 controls hyaluronan synthesis in human orbital fibroblasts via DP1 activation: implications for thyroid eye disease

Naxin Guo et al. J Biol Chem. .

Abstract

Thyroid eye disease (TED) is a debilitating disorder characterized by the accumulation of adipocytes and hyaluronan (HA). Production of HA by fibroblasts leads to remarkable increases in tissue volume and to the anterior displacement of the eyes. Prostaglandin D(2) (PGD(2)), mainly produced by mast cells, promotes orbital fibroblast adipogenesis. The mechanism by which PGD(2) influences orbital fibroblasts and their synthesis of HA is poorly understood. We report here that mast cell-derived PGD(2) is a key factor that promotes HA biosynthesis by orbital fibroblasts. Primary orbital fibroblasts from TED patients were isolated and used to test the effects of PGD(2), prostaglandin J(2), as well as prostaglandin D receptor (DP) agonists and antagonists on HA synthesis. The expression of HA synthase (HAS), hyaluronidase, DP1, and DP2 mRNA levels was assessed by PCR. Small interfering RNAs against HAS1 or HAS2 were used to assess the importance of HAS isoforms on HA production. Treatment of human orbital fibroblasts with PGD(2) and PGJ(2) increased HA synthesis and HAS mRNA. HAS2 was the dominant isoform responsible for HA production by PGD(2). The effect of PGD(2) on HA production was mimicked by the selective DP1 agonist BW245C. The DP1 antagonist MK-0524 completely blocked PGD(2)-induced HA synthesis. Human mast cells (HMC-1) produced PGD(2). Co-culture of HMC-1 cells with orbital fibroblasts induced HA production and inhibition of mast cell-derived PGD(2) prevented HA synthesis. Mast cell-derived PGD(2) increased HA production via activation of DP1. Selectively targeting the production of PGD(2) and/or activation of DP1 may prevent pathological changes associated with TED.


Figures

FIGURE 1.
FIGURE 1.
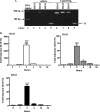
PGD2 and PGJ2 induce HA synthesis in human orbital fibroblasts. A, confluent strains of human orbital fibroblasts (OF1 and OF2) were cultured in RPMI 1640 with 0.5% FBS for 3 days prior to treatment with PGJ2, PGD2, or vehicle (DMSO) for 18 h. The cell culture medium was assayed for HA by an HA ELISA as described under ”Experimental Procedures.“ There was a significant increase in HA production by two strains of orbital fibroblasts following treatment with PGD2 (1–5 μm) and PGJ2 (2 μm). The experiment was performed in triplicate. *, p < 0.05; **, p < 0.01; ***, p < 0.001 compared with vehicle control. #, p < 0.05; ###, p < 0.001, OF1 versus OF2. Results are expressed as the mean ± S.D. (error bars). B, agarose gel HA analysis: Orbital fibroblasts (OF1 and OF2) were cultured in RPMI 1640 with 2% FBS for 3 days and then treated with 5 μm PGD2 (D2) or vehicle (V) for 18 h, and the conditioned medium was analyzed by agarose gel electrophoresis. Both OF1 and OF2 exhibited basal HA (lanes 3 and 5, respectively; blue). When treated with PGD2, there was an increase in color intensity, indicating increased HA production (lanes 4 and 6; compare with lanes 3 and 5). A Streptomyces hyaluronidase-digested sample (HA'ase) (from PGD2-treated OF2) was included as a negative control (lane 7).
FIGURE 2.
FIGURE 2.
Differential induction in HYAL mRNA between two orbital fibroblast strains. cDNA from orbital fibroblast strains OF1 and OF2 treated with 5 μm PGD2 or vehicle (Untreated) for 4 h was assessed by qRT-PCR. There was a significant increase in mRNA expression for all three HYAL isoforms (HYAL1, HYAL2, and HYAL3) when OF1 was treated with 5 μm PGD2 (***, p < 0.0001 compared with untreated). There was no significant increase in HYAL1 to -3 in PGD2-treated OF2 cells (ns, compared with untreated). The induction of HYAL1, HYAL2, and HYAL3 mRNA in PGD2-treated OF1 was significantly higher than PGD2-exposed OF2 HYAL expression ($$$, p < 0.0001 for each respective HYAL). Results are expressed as the mean ± S.D. (error bars) (n = 3).
FIGURE 3.
FIGURE 3.
PGD2 induces HAS mRNA in human orbital fibroblasts. A, RT-PCR analysis. cDNA from orbital fibroblasts treated with 5 μm PGD2 or vehicle for 2 h was amplified by RT-PCR and separated on 5% acrylamide gels. All three HAS isoforms are expressed in human orbital fibroblasts. Following treatment with PGD2, there was a relative increase in the abundance of HAS1, HAS2, and HAS3 mRNA. 7 S was used as a control. B, qRT-PCR. Total RNA from orbital fibroblasts treated with 5 μm PGD2 for 1–24 h was analyzed by qRT-PCR as described under ”Experimental Procedures.“ There was a significant increase in HAS mRNA levels (HAS1, HAS2, and HAS3) beginning at 2 h (***, p < 0.001 compared with time 0 for each HAS isoform). Of the three, HAS1 yielded the greatest increase (2807 ± 213-fold); this increase in HAS1 was significantly greater than HAS2 or HAS3 (###, p < 0.001). Expression of HAS1 and HAS2 remained significantly elevated through 4 h (*, p < 0.05). By 16 h, mRNA for HAS1, HAS2, and HAS3 was not different from control. Results are expressed as the mean ± S.D. (error bars) of triplicate samples performed on duplicate cultures.
FIGURE 4.
FIGURE 4.
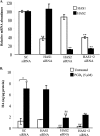
PGD2-induced HA production by orbital fibroblasts is dependent on HAS2 expression. A, orbital fibroblasts were transfected with siRNA for HAS1, HAS2, or a combination as described under ”Experimental Procedures.“ The cells were cultured for 24 h in RPMI 1640 with 0.5% FBS and treated with 5 μm PGD2 for 2 h, and HAS gene levels were analyzed by qRT-PCR. The mRNA for HAS1 and HAS2 in the PGD2-treated SC siRNA samples was standardized to 100 for comparison of gene expression. Each siRNA reduced its target mRNA expression selectively and significantly (up to 80%). **, p < 0.01. B, orbital fibroblasts transfected with siRNA for HAS1, HAS2, or a combination were cultured in RPMI 1640 with 0.5% FBS for 24 h and then exposed to 5 μm PGD2 for 18 h, and HA was analyzed by HA ELISA. Fibroblasts treated with PGD2 (black bars) increased HA synthesis. Knockdown of HAS2, but not HAS1, significantly reduced the ability of PGD2 to induce HA in human orbital fibroblasts. *, p < 0.05; **, p < 0.01 compared with PGD2-treated SC siRNA-transfected; ##, p < 0.01, untreated SC siRNA versus untreated HAS2 siRNA; ns, no significance, HAS2 siRNA-transfected, PGD2-treated fibroblasts versus untreated SC siRNA-transfected cells.
FIGURE 5.
FIGURE 5.
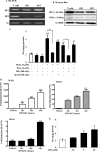
PGD2 and PGJ2 induce HA production in human orbital fibroblasts via DP1, but not DP2, activation. A, RT-PCR. Human orbital fibroblasts (OF1 and OF2) and T cells express DP1 and DP2 mRNA. Note the variability in the expression of DP2 between the two fibroblast strains. B, Western blot analysis revealed that orbital fibroblasts and T cells express both DP1 and DP2 protein. Membranes were reprobed for glyceraldehyde-3-phosphate dehydrogenase (GAPDH) to ensure equal protein loading. C, pharmacological inhibition of DP1, but not DP2, blocks PGD2- and PGJ2-induced HA production. Orbital fibroblasts were left untreated (Vehicle) or were pretreated with 100 nm of the DP1 antagonist MK-0524 (MK) or DP2 antagonist ramatroban (RAM) for 1 h with or without PGD2 or PGJ2 for 18 h, and HA ELISA was performed. Both PGD2 and PGJ2 significantly increased HA production compared with untreated (p < 0.001 (###) and p < 0.01 (##), respectively). Pretreatment of orbital fibroblasts with MK significantly decreased the ability of PGD2 (**, p < 0.01) and PGJ2 (*, p < 0.05) to induce HA levels. RAM was not able to prevent PGD2- and PGJ2-increased HA levels (p < 0.05 (#) and p < 0.01 (##) compared with vehicle control, respectively). ns, not significant compared with untreated (vehicle). D, treatment with the DP1 agonist BW245C significantly increased the expression of HAS mRNA. Orbital fibroblasts were cultured in reduced serum for 3 days and exposed to BW245C (10 μm) for the indicated times. There was a significant increase in HAS1 (329 ± 128-fold increase; **, p < 0.01) and HAS2 (17 ± 0.14-fold increase; ***, p < 0.001) at 2 h compared with vehicle control. HAS3 mRNA increased by 6 h (4.8 ± 0.06; ***, p < 0.01). E, activation of DP1 by the selective agonist BW245C induces HA. There was a significant increase in HA when fibroblasts were treated with 5 and 10 μm BW245C (p < 0.05 (*) and p < 0.01 (**), respectively, compared with vehicle control. Samples were run in duplicate, utilizing three separate human orbital fibroblast strains (representative results are shown).
FIGURE 6.
FIGURE 6.
PGD2-induced HA synthesis is through the DP1-cAMP signal pathway. A, DP1 activation by PGD2 or BW245C increases intracellular cAMP level. Orbital fibroblasts were treated with PGD2 or BW245C for up to 60 min, and intracellular cAMP was detected as described under ”Experimental Procedures.“ There was a significant increase in cAMP within 15 min of treatment with PGD2 compared with vehicle control (*, p < 0.05). cAMP further increased by 30 and 60 min (***, p < 0.001). B, cultures of confluent orbital fibroblasts were treated with 5 μm forskolin or 200 μm IBMX, with or without 5 μm PGD2 or 2 μm PGJ2, for 18 h, and the cell culture supernatant was collected for HA ELISA. There was a significant increase in HA when cells were treated with forskolin, PGD2, or PGJ2 compared with vehicle-treated (open bar) (*, p < 0.05; **, p < 0.01). Augmenting cAMP (via IBMX) in conjunction with PGD2 or PGJ2 significantly increased HA when compared with PGD2 and PGJ2 alone (#, p < 0.05). Results are expressed as the mean ± S.D. (error bars).
FIGURE 7.
FIGURE 7.
PGD2 production by mast cells is dependent on H-PGDS activity. A, Western blot of HMC-1 cells indicates the expression of Cox-1 and H-PGDS. Unactivated HMC-1 cells do not express Cox-2. Glyceraldehyde-3-phosphate dehydrogenase (GAPDH) was used as a housekeeping protein. B, inhibition of H-PGDS activity ameliorates the production of PGD2 by activated mast cells. HMC-1 cells were treated with HQL-79 for 1 h, followed by activation with A23187, and cell culture supernatant was assessed for PGD2 levels by commercial EIA kit. Activation of HMC-1 cells with A23187 significantly increased PGD2 production (###, p < 0.001 compared with untreated). Inclusion of HQL-79 significantly reduced PGD2 production (***, p < 0.001).
FIGURE 8.
FIGURE 8.
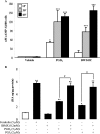
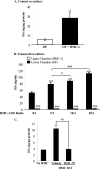
Mast cell-derived PGD2 activates orbital fibroblasts to produce HA. A, contact co-culture. Confluent orbital fibroblasts were seeded with HMC-1 cells at a cell ratio of 1:1 for 4 h. The mast cells were then removed, the fibroblasts were washed, and fresh medium was added for another 18 h. The medium was collected for HA ELISA. Co-culture of orbital fibroblasts with HMC-1 cells significantly increased HA synthesis (**, p < 0.001). B, transwell co-culture. HMC-1 cells and confluent fibroblasts were co-cultured in a transwell system, where the fibroblasts and HMC-1 cells were separated by a 0.4-μm membrane; the HMC-1/orbital fibroblast (OF) ratio was 5:1, 10:1, or 20:1. The conditioned medium from both chambers was collected for HA ELISA. There was a significant difference in HA levels between HMC-1 (upper chamber, open bars) and orbital fibroblasts (lower chamber, black bars) (#, p < 0.05; ###, p < 0.001). Co-culture of orbital fibroblasts with HMC-1 cells significantly increased HA production only by the fibroblasts (lower chamber) (***, p < 0.001 compared with no HMC-1 cells). C, inhibition of PGD2 secretion by HMC-1 cells prevents HA production by orbital fibroblasts. HMC-1 cells were treated with the H-PGDS inhibitor HQL-79 prior to co-culturing (ratio 20:1) with orbital fibroblasts. There was a significant increase in HA synthesis when fibroblasts were cultured with HMC-1 cells (**, p < 0.01 compared with no HMC). This increase in HA was attenuated when PGD2 production in mast cells was prevented by HQL-79 (##, p < 0.001, HQL-79 compared with vehicle).
FIGURE 9.
FIGURE 9.
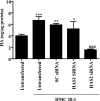
siRNA against orbital fibroblast HAS2 prevents mast cell-derived PGD2 induction of HA. Orbital fibroblasts were transfected with HAS1, HAS2, or SC siRNA using Lipofectamine 2000 (Invitrogen). Following this, the fibroblasts were co-cultured for 24 h with HMC-1 cells in a transwell system at a ratio of 20:1 (mast cells/orbital fibroblasts), and the media were collected for HA detection. Untransfected orbital fibroblast co-cultured with HMC-1 cells significantly increased HA production (***, p < 0.0001; compared with untransfected without co-culture). Co-culture of fibroblasts with HMC-1 cells also induced a significant increase in HA in SC siRNA-transfected (**, p < 0.001) and HAS1 siRNA-transfected (*, p < 0.05) orbital fibroblasts. HAS2 siRNA-transfected orbital fibroblasts failed to increase HA synthesis when co-cultured with HMC-1 cells (###, p < 0.0001 compared with untransfected, control siRNA, and HAS1 siRNA). Results are expressed as mean ± S.D. (n = 4–6).

Similar articles

Cited by

References

    1. Prabhakar B. S., Bahn R. S., Smith T. J. (2003) Endocr. Rev. 24, 802–835 - PubMed
    1. Lehmann G. M., Garcia-Bates T. M., Smith T. J., Feldon S. E., Phipps R. P. (2008) PPAR Res. 2008, 895901. - PMC - PubMed
    1. Feldon S. E., O'loughlin C. W., Ray D. M., Landskroner-Eiger S., Seweryniak K. E., Phipps R. P. (2006) Am. J. Pathol. 169, 1183–1193 - PMC - PubMed
    1. Smith T. J., Hoa N. (2004) J. Clin. Endocrinol. Metab. 89, 5076–5080 - PubMed
    1. Kuriyan A. E., Phipps R. P., Feldon S. E. (2008) Curr. Opin. Ophthalmol. 19, 499–506 - PMC - PubMed

Publication types

MeSH terms