. 2010 May 21;285(21):15805-15.
doi: 10.1074/jbc.M110.101980. Epub 2010 Mar 22.

A putative extracellular salt bridge at the subunit interface contributes to the ion channel function of the ATP-gated P2X2 receptor

Affiliations

A putative extracellular salt bridge at the subunit interface contributes to the ion channel function of the ATP-gated P2X2 receptor

Ruotian Jiang et al. J Biol Chem. .

Abstract

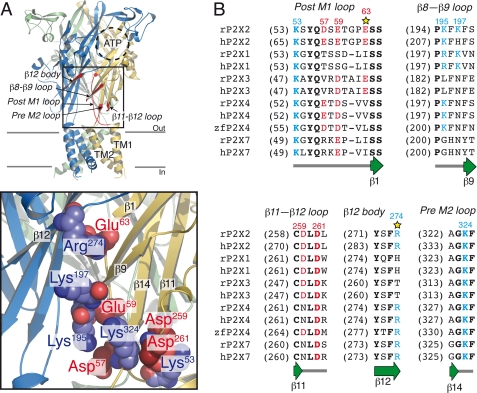
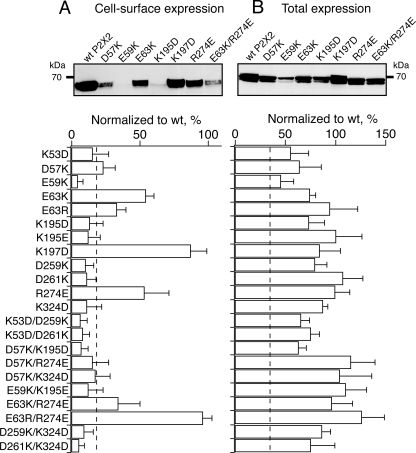
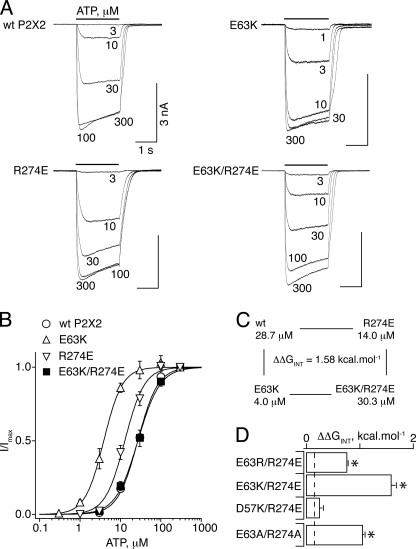
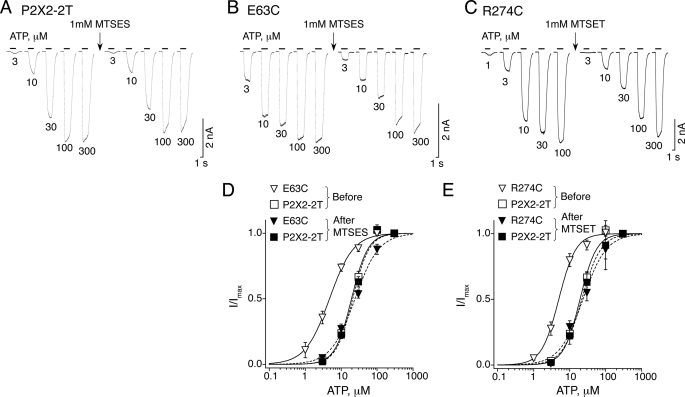
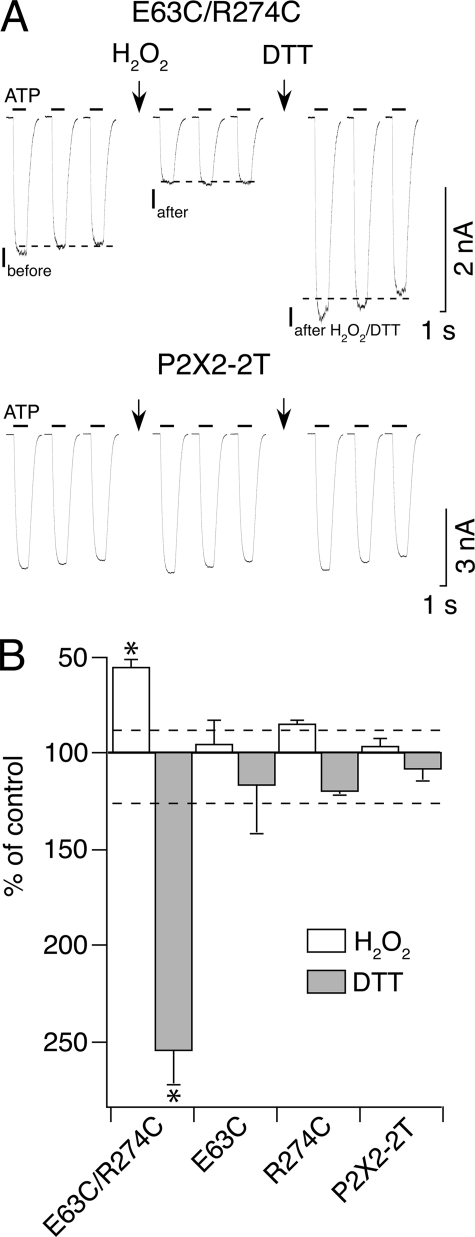
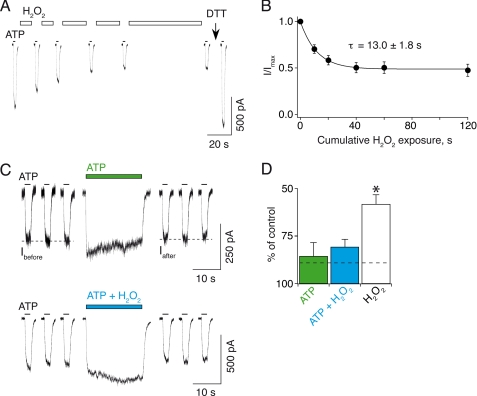
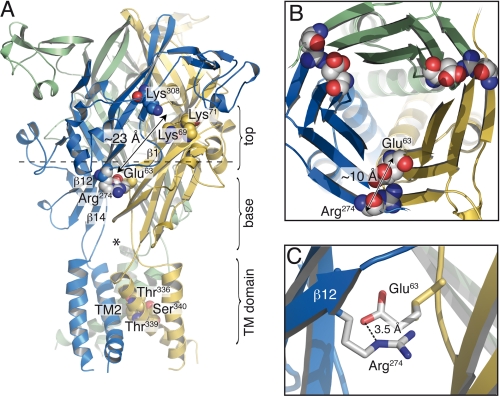
The recent crystal structure of the ATP-gated P2X4 receptor revealed a static view of its architecture, but the molecular mechanisms underlying the P2X channels activation are still unknown. By using a P2X2 model based on the x-ray structure, we sought salt bridges formed between charged residues located in a region that directly connects putative ATP-binding sites to the ion channel. To reveal their significance for ion channel activation, we made systematic charge exchanges and measured the effects on ATP sensitivity. We found that charge reversals at the interfacial residues Glu(63) and Arg(274) produced gain-of-function phenotypes that were cancelled upon paired charge swapping. These results suggest that a putative intersubunit salt bridge formed between Glu(63) and Arg(274) contributes to the ion channel function. Engineered cysteines E63C and R274C formed redox-dependent cross-links in the absence of ATP. By contrast, the presence of ATP reduced the rate of disulfide bond formation, indicating that ATP binding might trigger relative movement of adjacent subunits at the level of Glu(63) and Arg(274), allowing the transmembrane helices to open the channel.


Figures

FIGURE 1.
FIGURE 1.
Molecular model of rat P2X2R. A, top, lateral view of the model illustrating the five segments (red) containing the investigated titratable residues. The putative ATP-binding site, TM1, and TM2 are also indicated. Bottom, close-up view of pairs of titratable residues. Also indicated are the β-strand numbers. Each subunit is depicted in a different color. B, sequence alignment of these five segments of rat (r), human (h), and zebrafish (zf) P2X1-P2X4 and P2X7. Conserved (in at least two homologues) basic (blue) and acidic (red) charged residues are indicated. Identical residues are shown in boldface type. Secondary structure elements are indicated in a schematic diagram below the alignment. A star labels the identified positions.
FIGURE 2.
FIGURE 2.
Cell surface and total expression of charge reversal and charge swap mutants expressed in HEK-293 cells. A, top, Western blot analysis probed with anti-c-Myc antibody of biotinylated WT and mutant P2X2 receptors, which represent cell surface-targeted receptors. Bottom, summary of the cell surface expression data. The dashed line indicates the level of 2σ error, which corresponds to ±18%. B, top, corresponding Western blot of total expression probed with anti-c-Myc antibody. Bottom, summary of the total expression data. Data are from 3–7 independent transfections. The dashed line indicates the level of 2σ error, which corresponds to ±35%. For both A and B, SDS-polyacrylamide gels were run in the presence of DTT. Also indicated is the position of the apparent molecular mass marker (in kDa). WT P2X2 expression was set to 100%.
FIGURE 3.
FIGURE 3.
Charge exchange between positions 63 and 274 restores WT-like ATP sensitivity. A, representative recordings from HEK-293 cells transfected with WT, E63K, R274E, and E63K/R274E P2X2 receptors. The bars above the recordings indicate the interval of ATP application. Also indicated are the ATP concentrations. B, concentration-response curves for WT P2X2 (○), E63K (▵), R274E (▿), and E63K/R274E (■). C, mutant cycle analysis showing strong coupling between Glu63 and Arg274. D, histogram showing the calculated coupling energy (ΔΔGINT) for the indicated pairs, E63R/R274E, E63K/R274E, D57K/R274E, and E63A/R274A. The dashed line indicates the experimental error (2σ), which corresponds to ±0.13 kcal/mol. *, values are significantly different from D57K/R274E. Data points and error bars in this and all other figures represent mean ± S.E.
FIGURE 4.
FIGURE 4.
Modifications of single mutants with charged MTS reagents restore electrostatic interaction. A, a 1-min application of 1 mm MTSES (indicated by an arrow) does not change responses evoked by different concentrations of ATP (indicated below recordings) on P2X2-2T. B, the same protocol as described in A changes responses in E63C single mutant introduced in the P2X2-2T background. C, the same protocol as described in A changes responses in R274C single mutant introduced in the P2X2-2T background except that MTSET is used instead. D, summary of the data (from n = 4–7 cells) obtained for E63C mutant (▿) and P2X2-2T (□) before (solid curves) and after MTSES treatment (dashed curves) for E63C (▾) and P2X2-2T (■). E, summary of the data (from n = 4 cells) obtained for R274C (▿) and P2X2-2T (□) before (solid curves) and after MTSET treatment (dashed curves) for R274C (▾) and P2X2-2T (■). For each cell, data were normalized to currents evoked by 300 μm ATP before and after MTS modification.
FIGURE 5.
FIGURE 5.
Engineered disulfide cross-linking experiments support interaction between positions 63 and 274. A, top, a 120-s application of 0.3% H2O2 (first arrow) reduces responses evoked by 30 μm ATP in the E63C/R274C double mutant introduced in the P2X2-2T background. A subsequent 120-s application of 10 mm DTT (second arrow) on the same cell potentiates responses. Ibefore and Iafter represent responses before and after H2O2 application, respectively, and Iafter H2O2/DTT represents those after H2O2 and DTT applications. Note that Iafter H2O2/DTT is larger than Ibefore. Bottom, the same protocol applied on the P2X2-2T receptor has no effect on responses evoked by 10 μm ATP. B, average of the data using the protocol shown in A for E63C/R274C (n = 11), E63C (3 μm ATP, n = 4), R274C (3 μm, n = 6), and P2X2-2T (n = 5). The dashed lines indicate the 2σ levels for inhibition and potentiation, which correspond to ±12 and ±26%, respectively. *, values are significantly different from E63C, R274C, and P2X2-2T.
FIGURE 6.
FIGURE 6.
State-dependent disulfide cross-linking of engineered cysteines in E63C/R274C mutant. A, cumulative applications of 0.3% H2O2 indicated by white bars between current traces progressively reduce responses evoked by 30 μm ATP. Reversibility is checked by a 120-s exposure of DTT applied on the same cell. For clarity, only one current trace of consecutive test pulses is shown. B, observed decrease of ATP responses plotted versus cumulative H2O2 exposure. Data obtained from 7–10 cells are normalized at t = 0 and fitted to a single exponential decay curve (see “Data Analysis”; τ = 13.0 ± 1.8 s; A = 0.50 ± 0.05; I = 0.50 ± 0.05). C, top, a 20-s application of 100 μm ATP alone (green bar above current trace) barely reduces responses evoked by 30 μm ATP. Ibefore and Iafter represent responses before and after application, respectively. Bottom, in another cell, a 20-s co-application of 100 μm ATP plus 0.3% H2O2 (blue bar) does not further reduce responses evoked by 30 μm ATP. D, summary of the inhibitions induced within 20 s by 100 μm ATP alone (green bar, n = 6), 100 μm ATP plus 0.3% H2O2 (blue bar, n = 7), and 0.3% H2O2 alone (white bar, n = 9). The dashed line indicates the 2σ level, which corresponds to ±11%. *, value is significantly different from ATP and ATP plus H2O2.
FIGURE 7.
FIGURE 7.
Glu63 and Arg274 form a salt bridge in a rat P2X2R molecular model. A, location of the identified residues viewed laterally. The upper part (top) and bottom (base) of the β-sandwich, along with the TM domain, are indicated. The star marks one of the three fenestrations between subunits. Also indicated are the residues previously shown to be important for ATP action (Lys69, Lys71, and Lys308) and ion permeation (Thr336, Thr339, and Ser340), the β-strand numbers, and one of the three TM2s. Also shown is the distance between the investigated region and the putative ATP-binding site. B, slab view of the bottom part of the ectodomain from the extracellular side (indicated by a dashed bar in A), along the ion pore axis, showing the pair of interacting residues at the subunit interface. Also shown is the distance between the α-carbons. Each subunit is depicted in a different color. C, close-up view of the salt bridge formed between the negatively charged Glu63 residue from one subunit (shown in yellow) and the positively charged Arg274 residue from another (blue).

Similar articles

Cited by

References

    1. Surprenant A., North R. A. (2009) Annu. Rev. Physiol. 71, 333–359 - PubMed
    1. Evans R. J., Derkach V., Surprenant A. (1992) Nature 357, 503–505 - PubMed
    1. Khakh B. S., Gittermann D., Cockayne D. A., Jones A. (2003) J. Neurosci. 23, 7426–7437 - PMC - PubMed
    1. Bo X., Alavi A., Xiang Z., Oglesby I., Ford A., Burnstock G. (1999) Neuroreport 10, 1107–1111 - PubMed
    1. Finger T. E., Danilova V., Barrows J., Bartel D. L., Vigers A. J., Stone L., Hellekant G., Kinnamon S. C. (2005) Science 310, 1495–1499 - PubMed

Publication types

LinkOut - more resources