. 2010 May 28;285(22):16664-74.
doi: 10.1074/jbc.M110.112805. Epub 2010 Mar 22.

Long chain acyl-CoA synthetase-3 is a molecular target for peroxisome proliferator-activated receptor delta in HepG2 hepatoma cells

Affiliations

Long chain acyl-CoA synthetase-3 is a molecular target for peroxisome proliferator-activated receptor delta in HepG2 hepatoma cells

Aiqin Cao et al. J Biol Chem. .

Abstract

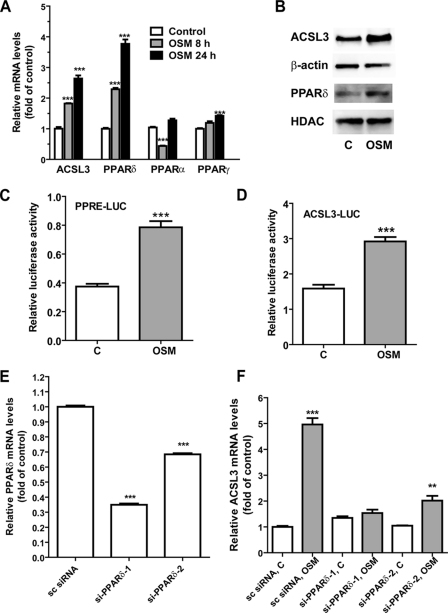
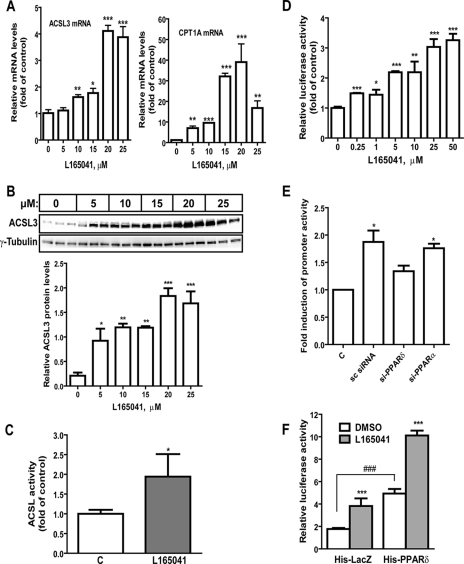
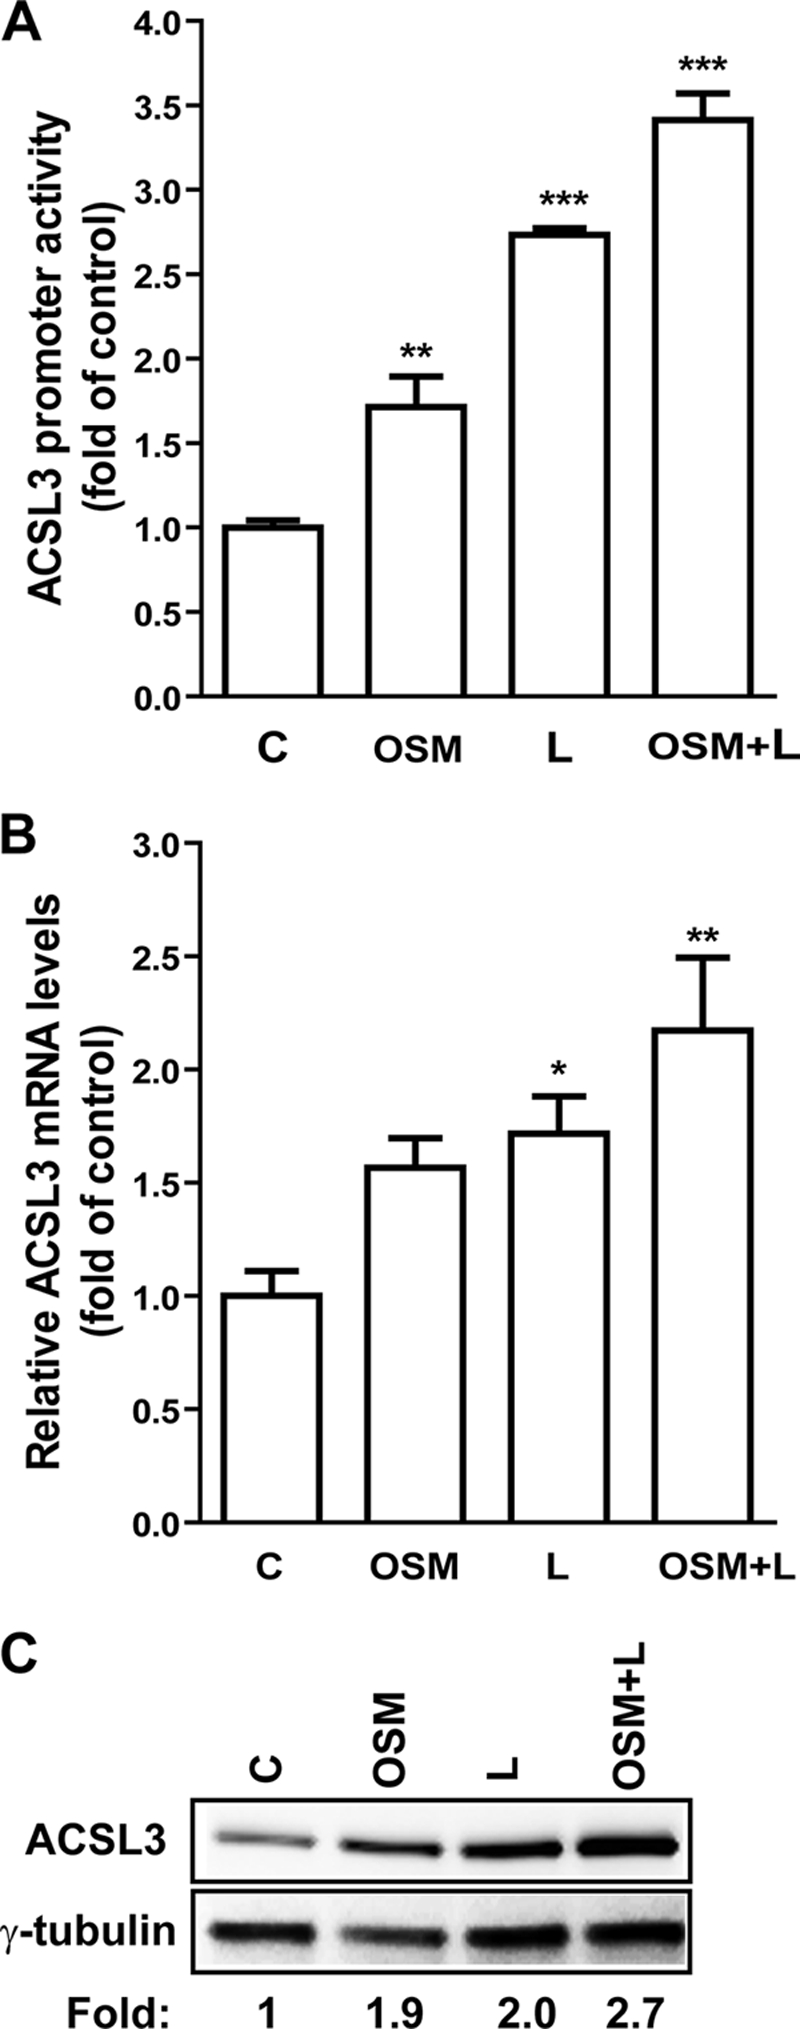
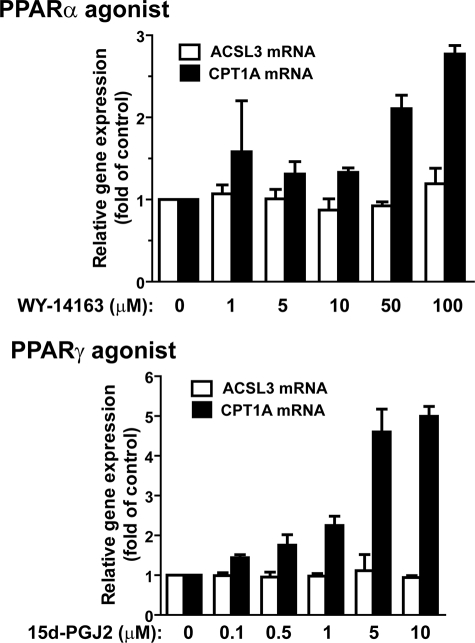
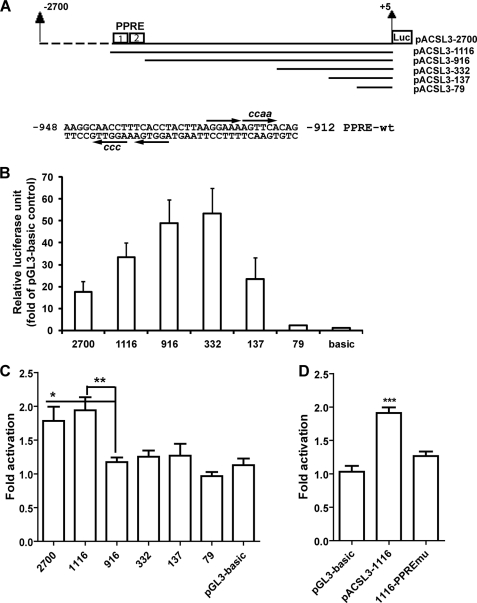
ACSL3 is a member of the long chain acyl-CoA synthetase (ACSL) family that plays key roles in fatty acid metabolism in various tissues in an isozyme-specific manner. Our previous studies showed that ACSL3 was transcriptionally up-regulated by the cytokine oncostatin M (OSM) in HepG2 cells, accompanied by reduced cellular triglyceride content and enhanced beta-oxidation. In this study, we investigated the molecular mechanism underlying the OSM-induced activation of ACSL3 gene transcription in HepG2 cells. We showed that OSM treatment resulted in a coordinated elevation of mRNA levels of ACSL3 and peroxisome proliferator-activated receptor delta (PPARdelta). The effect of OSM on ACSL3 mRNA expression was inhibited by cellular depletion of PPARdelta. By utilizing a PPARdelta agonist, L165041, we demonstrated that activation of PPARdelta led to increases in ACSL3 promoter activity, mRNA level, and protein level in HepG2 cells. Analysis of the ACSL3 promoter sequence identified two imperfect PPAR-responsive elements (PPRE) located in the ACSL3 promoter region -944 to -915, relative to the transcription start site. The up-regulation of ACSL3 promoter activity by PPARdelta was abolished by deletion of this PPRE-containing region or mutation to disrupt the binding sites. Direct interactions of PPARdelta with ACSL3-PPRE sequences were demonstrated by gel mobility shift and chromatin immunoprecipitation assays. Finally, we provided in vivo evidence showing that activation of PPARdelta by L165041 in hamsters increased ACSL3 mRNA and protein levels in the liver. These new findings define ACSL3 as a novel molecular target of PPARdelta in HepG2 cells and provide a regulatory mechanism for ACSL3 transcription in liver tissue.


Figures

FIGURE 1.
FIGURE 1.
Involvement of PPARδ in OSM-mediated up-regulation of ACSL3 gene transcription. A, HepG2 cells were treated with 50 ng/ml of OSM for 8 and 24 h. Total RNA was isolated and mRNA levels of PPARα, PPARγ, PPARδ, and ACSL3 were quantified by real time quantitative PCR. The figure shown is representative of 3 independent experiments. In B, HepG2 cells were treated with 100 ng/ml of OSM for 24 h. Total cell lysates and nuclear extracts were isolated. Total cell lysates were used for detecting ACSL3 and nuclear extracts were used for PPARδ detection by Western blotting. β-Actin and histone deacetylase were used as loading control for whole cell lysate and nucler extracts, respectively. In C and D, suspended HepG2 cells were transfected with plasmids (PPRE)3-tk-luc or phACSL3Luc along with a Renilla luciferase expression vector (pRL-SV40) and then seeded in a 96-well culture plate for 24 h. Transfectants were treated with OSM or its vehicle (phosphate-buffere saline) for 16 h prior to cell lysis for dual luciferase assays. Firefly luciferase activity was normalized to Renilla luciferase activity in each sample. The figure shown is representative of 3 independent experiments. In E, cells were transfected with siRNAs targeted to PPARδ, or a control nonspecific siRNA for 2 days prior to cell lysis to analyze PPARδ and glyceraldehyde-3-phosphate dehydrogenase mRNA levels by real time PCR. In F, cells were transfected with siRNAs for 24 h before the addition of OSM or vehicle for 16 h. ***, p < 0.001 compared with untreated control in A–D and F or compared with nonspecific siRNA in E. **, p < 0.01 compared with control. Each value represents the mean ± S.D. of triplicate assays per condition.
FIGURE 2.
FIGURE 2.
Activation of PPARδ leads to increased ACSL3 expression. A, HepG2 cells were treated with different doses of L165041 for 16 h. Total RNA was isolated and mRNA levels of ACSL3 and CPT1A were determined by quantitative real time PCR. The figure shown is representative of 3 separate assays. B, HepG2 cells were treated with the indicated doses of L165041 for 24 h with triplicate dishes for each condition. Total cell lysates were probed with anti-ACSL3 antibody, followed by anti-γ-tubulin antibody. The signal intensity of ACSL3 was normalized to that of tubulin and presented in the lower panel. The figure shown is representative of 2 separate assays. C, HepG2 cells were treated with 25 μm L165041 for 24 h. Cells were lysed and ACSL activity in 30 μg of cytosolic protein was measured. The figure shown is representative of 2 separate assays. D, HepG2 cells were co-transfected with ACSL3 promoter luciferase reporter (pACSL3-2700) and pRL-SV40 for 24 h prior to treatment of L165041 at the indicated doses for 16 h. Triplicate wells were used in each condition. The normalized luciferase activities in untreated samples were set as 1 and luciferase activities in treated samples were plotted relative to control. The figure shown is representative of 2 independent experiments. E, HepG2 cells were transfected with si-PPARδ-1, si-PPARα, or scrambled control siRNA for 24 h, followed by cotransfection of pACSL3-1116 and pRL-SV40 plasmids. After 24 h of reporter transfection, cells were treated with 10 μm L165041 or DMSO for 16 h before cell lysis for dual luciferase activity assay. The figure shown is representative of 3 independent experiments in which 4 wells were used in each transfection condition. F, HepG2 cells were cotransfected with pACSL3-2700, pHis-PPARδ, and pRL-SV40 in a DNA ratio of 1:1:0.05 or with the same amount of DNA containing pACSL3-2700, pHis-LacZ, and pRL-SV40 for 24 h prior to treatment of L165041 for 16 h. The figure shown is representative of 2 separate transfection experiments in which 8 wells were used in each transfection condition. *, p < 0.05; **, p < 0.01; and ***, p < 0.001 compared with untreated control; ###, p < 0.001 compared with untreated His-LacZ control. In A–D, each value represents the mean ± S.D. of triplicate assays per condition (A–D); in E, each value represents the mean ± S.D. of 4 wells per condition; in F, each value represents the mean ± S.D. of 8 wells per condition.
FIGURE 3.
FIGURE 3.
Induction of ACSL3 gene transcription by OSM, L165041, and the combined treatment. A, HepG2 cells were cotransfected with pACSL3-1116 or pRL-SV40 for 24 h. Transfectants were treated with OSM, L165041 (L), or OSM + L165041 (OSM + L) for 16 h before harvesting cells for dual luciferase assays. B, cells were treated with OSM, L165041, or the combination for 16 h prior to cell lysis to harvest RNA for real time PCR analysis. C, cells were treated with OM, L165041, or the combination for 24 h prior to harvesting protein for Western blotting. Each figure shown is representative of three separate experiments. *, p < 0.05; **, p < 0.01; ***, p < 0.001 as compared with control. Each value represents the mean ± S.D. of triplicate assays per condition.
FIGURE 4.
FIGURE 4.
The expression of ACSL3 mRNA was not affected by activation of PPARα or PPARγ. HepG2 cells were treated with PPARα agonist WY-14643 or PPARγ agonist 15d-PGJ2 at the indicated concentrations for 16 h. Total RNA was isolated to assess the mRNA levels of ACSL3, CPT1A, and glyceraldehyde-3-phosphate dehydrogenase. The figures shown are representative of 2 independent experiments. Each value represents the mean ± S.D. of triplicate assays per condition.
FIGURE 5.
FIGURE 5.
Analysis of basal and L165041-induced luciferase activities in HepG2 cells transfected with ACSL3 promoter constructs. A, schematic presentation of the deletion constructs of the ACSL3 promoter luciferase reporters and the nucleotide sequences of the putative PPRE sequences. Each arrow indicates the half-site and the lower case letters are mutated nucleotides. Nucleotide position was defined relative to the TSS. B and C, ACSL3 promoter luciferase reporters were transiently cotransfected with pRL-SV40 into HepG2 cells for 24 h, followed with a 16-h treatment of L165041. After normalization, the relative basal luciferase activity of each reporter was expressed as the fold of pGL3-basic (B) and the fold-activation by L165041 was calculated by dividing the normalized luciferase activity in treated cells with the value in untreated cells of each construct (C). Results shown are mean ± S.D. of 5 separate transfections in which triplicate samples were measured for each condition. *, p < 0.05; **, p < 0.01 as compared with the construct without PPRE sites. D, the ACSL3 promoter wild-type (pACSL-1116) and PPRE-mutated site construct vector (1116-PPREmu) were cotransfected with pRL-SV40 into HepG2 cells. The plasmid pGL3-basic was included in the transfection as a negative control for L165041 treatment. ***, p < 0.001 as compared with pGL3-basic. Each value represents the mean ± S.D. of triplicate assays per condition.
FIGURE 6.
FIGURE 6.
Electrophoretic mobility shift assay and ChIP analyses of PPARδ association with PPRE sites of ACSL3 promoter in vitro and in vivo. A, labeled ACSL3-PPRE probe was incubated with 150 ng of PPARδ and 50 ng of RXRα recombinant proteins in the absence (lane 2) or presence of 100-fold molar excess of unlabeled wild-type probe (lane 3) or mutated probe (lane 4). The binding reaction was also carried out in the presence of 1 μg of anti-PPARδ antibody (lane 5). B, labeled ACSL3-PPRE probe was incubated with 30 μg of nuclear extracts (lanes 2–6) with and without the indicated competitors. In lanes 7–12, different amounts of nuclear extracts of control or OSM-treated cells were examined in the binding assays. C, anti-PPARδ antibody was used in a ChIP analysis followed by PCR to amplify a 164-bp fragment of the human ACSL3 promoter region −1020 to −857 and a 238-bp fragment of the ACSL3 promoter region (−3600 to −3363) from genomic DNA isolated from HepG2 cells untreated or treated with OSM or L165041. Normal rabbit IgG was included in the assay as negative controls for nonspecific binding. The PCR product was separated on a 2% agarose gel and stained with ethidium bromide. Input represents the starting material before immunoprecipitation. The data shown are representative of 2 separate ChIP assays with similar results. D, real time PCR analysis was conducted to amplify the ACSL3-PPRE promoter region (−1020 to −857). Each immunoprecipitated DNA sample was analyzed in triplicates. The data are expressed as relative increases for the ratio of signal from PPARδ antibody-enriched chromatin relative to a control IgG. The ratio of untreated cells was set as 1, and ratios in treated samples were plotted relative to the control. *, p < 0.05; **, p < 0.01, as compared with control. Each value represents the mean ± S.D. of triplicate assays per condition.
FIGURE 7.
FIGURE 7.
Effects of activation of PPARδ on liver ACSL3 expression and plasma TG and TC levels. Hamsters (n = 9) were treated with 10 mg/kg of L165041 or vehicle (n = 9) for 7 days. At the end of treatment, animals were sacrificed and serum and liver tissues were isolated. In A, total RNA was isolated from each liver sample and the relative mRNA abundance of ACSL3 and CPT1A were determined by conducting real time PCR and normalized to glyceraldehyde-3-phosphate dehydrogenase. *, p < 0.05 as compared with control group. Data shown are mean ± S.E. of 7–9 samples per group. In B, total protein extracts were individually prepared from 6 randomly chosen liver samples of the vehicle or treatment groups. Equal amounts of homogenate proteins (50 μg) were resolved by SDS-PAGE and ACSL3 protein was detected by immunoblotting using a rabbit anti-ACSL3 antibody. The membrane was reprobed with an anti-β-actin antibody. In C, levels of TG and TC in serum samples of treated and vehicle control groups were individually measured. Data shown are mean ± S.E. of 8 to 9 samples per group. *, p < 0.05.

References

    1. Mashek D. G., Coleman R. A. (2006) Curr. Opin. Lipidol. 17, 274–278 - PubMed
    1. Soupene E., Kuypers F. A. (2008) Exp. Biol. Med. 233, 507–521 - PMC - PubMed
    1. Suzuki H., Kawarabayasi Y., Kondo J., Abe T., Nishikawa K., Kimura S., Hashimoto T., Yamamoto T. (1990) J. Biol. Chem. 265, 8681–8685 - PubMed
    1. Oikawa E., Iijima H., Suzuki T., Sasano H., Sato H., Kamataki A., Nagura H., Kang M. J., Fujino T., Suzuki H., Yamamoto T. T. (1998) J. Biochem. 124, 679–685 - PubMed
    1. Fujino T., Kang M. J., Suzuki H., Iijima H., Yamamoto T. (1996) J. Biol. Chem. 271, 16748–16752 - PubMed

Publication types