Mutation and the evolution of recombination
- PMID: 20308104
- PMCID: PMC2871826
- DOI: 10.1098/rstb.2009.0320
Mutation and the evolution of recombination
Abstract
Under the classical view, selection depends more or less directly on mutation: standing genetic variance is maintained by a balance between selection and mutation, and adaptation is fuelled by new favourable mutations. Recombination is favoured if it breaks negative associations among selected alleles, which interfere with adaptation. Such associations may be generated by negative epistasis, or by random drift (leading to the Hill-Robertson effect). Both deterministic and stochastic explanations depend primarily on the genomic mutation rate, U. This may be large enough to explain high recombination rates in some organisms, but seems unlikely to be so in general. Random drift is a more general source of negative linkage disequilibria, and can cause selection for recombination even in large populations, through the chance loss of new favourable mutations. The rate of species-wide substitutions is much too low to drive this mechanism, but local fluctuations in selection, combined with gene flow, may suffice. These arguments are illustrated by comparing the interaction between good and bad mutations at unlinked loci under the infinitesimal model.
Figures

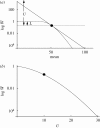
 . Therefore, if the effects of deleterious mutations are multiplicative (shown by a straight line on this log scale), the mutation load (defined as the difference in log fitness between the fittest genotype and the population mean) is L = U, as indicated at left. With negative epistasis (shown by the curve), the distance at left between the tangent and the mean fitness is still equal to U, but the mutation load, L, is much smaller. In this example, truncation selection acts on the number of deleterious mutations, with a fraction L = 0.2 surviving, and genomic mutation rate U = 10; dots indicate the equilibrium point. The population is assumed to cluster around the mean, and to be at linkage equilibrium. (b) The log mean fitness at equilibrium as a function of U, keeping genotype fitnesses the same as in (a). This decreases steeply with further increases of U.


References
-
- Agrawal A. F.2001Sexual selection and the maintenance of sexual reproduction. Nature 411, 692–695 (doi:10.1038/35079590) - DOI - PubMed
-
- Agrawal A. F.2006Evolution of sex: why do organisms shuffle their genotypes? Curr. Biol. 16, 696–704 (doi:10.1016/j.cub.2006.07.063) - DOI - PubMed
-
- Bachtrog D., Charlesworth B.2002Reduced adaptation of a non-recombining neo-Y chromosome. Nature 416, 323–326 (doi:10.1038/416323a) - DOI - PubMed
-
- Barton N. H.1994The reduction in fixation probability caused by substitutions at linked loci. Genet. Res. 64, 199–208 (doi:10.1017/S0016672300032857) - DOI
Publication types
MeSH terms
LinkOut - more resources
Full Text Sources
Research Materials
