

Role of excessive inflammatory response to Stenotrophomonas maltophilia lung infection in DBA/2 mice and implications for cystic fibrosis
- PMID: 20308302
- PMCID: PMC2876550
- DOI: 10.1128/IAI.01391-09
Role of excessive inflammatory response to Stenotrophomonas maltophilia lung infection in DBA/2 mice and implications for cystic fibrosis
Abstract
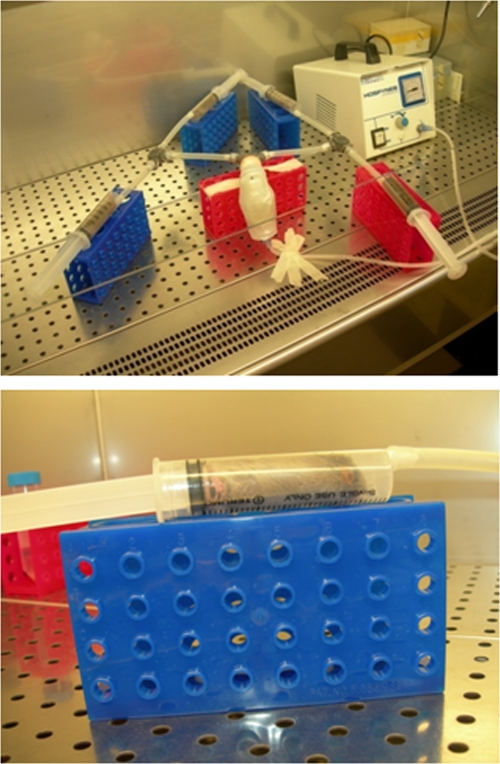
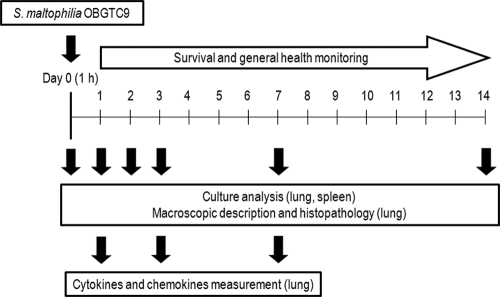
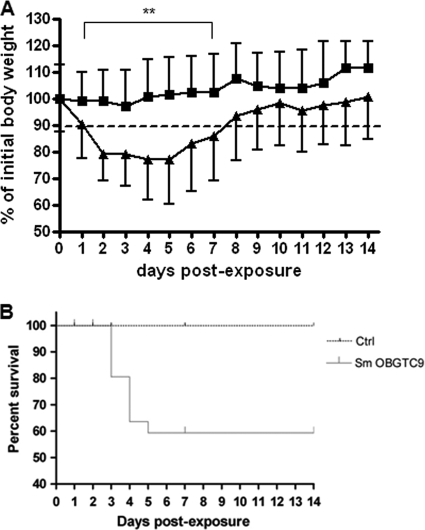
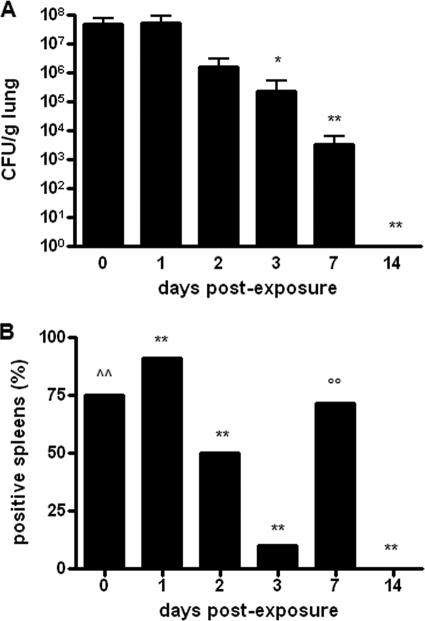
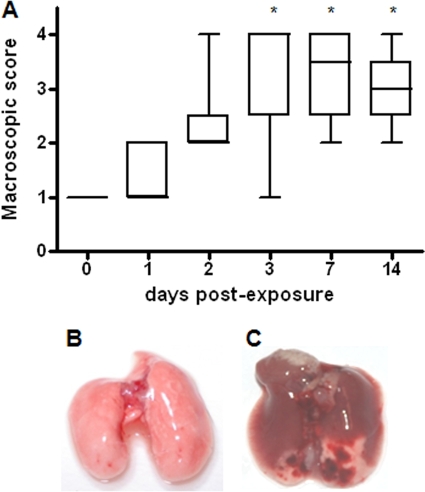
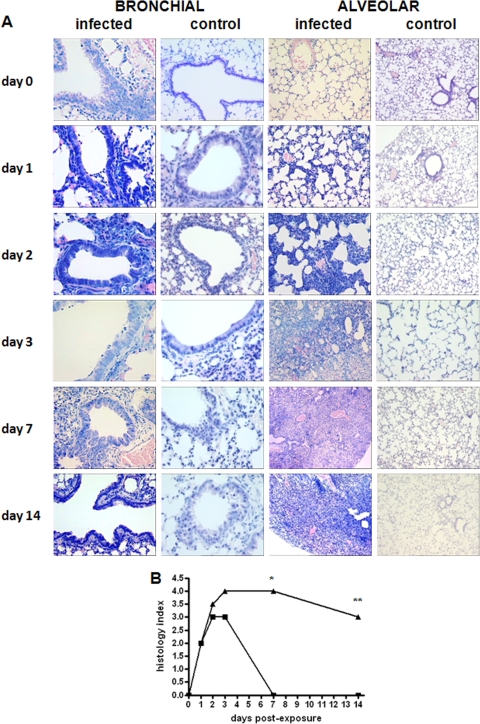
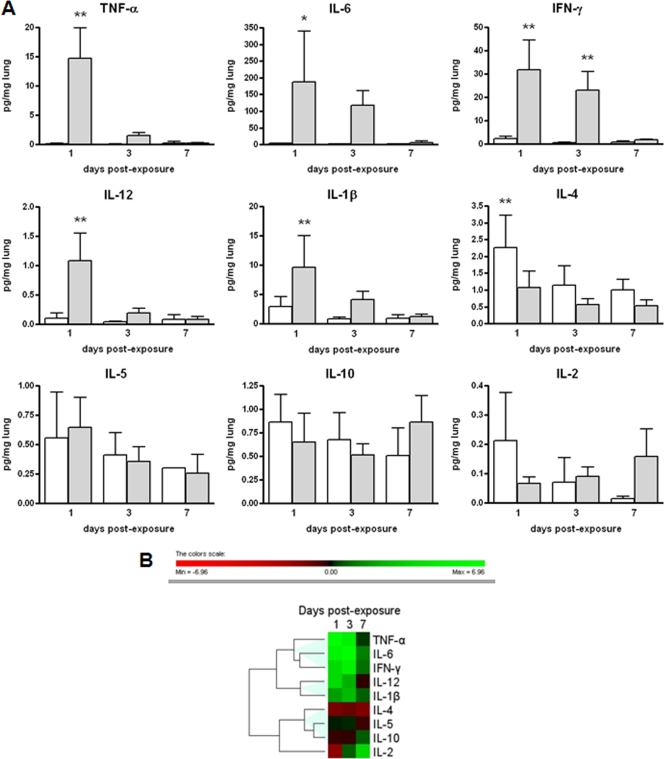
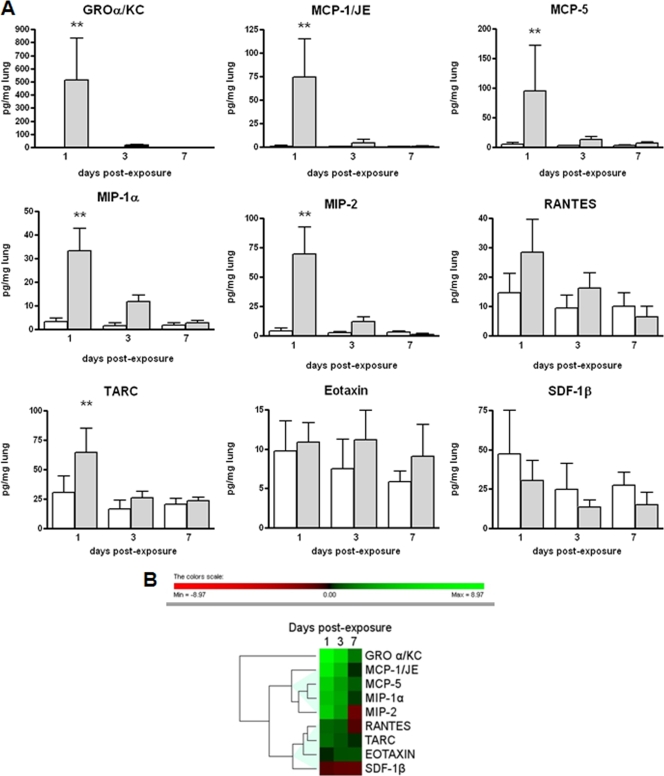
Stenotrophomonas maltophilia is a pathogen that causes infections mainly in immunocompromised patients. Despite increased S. maltophilia isolation from respiratory specimens of patients with cystic fibrosis (CF), the real contribution of the microorganism to CF pathogenesis still needs to be clarified. The aim of the present study was to evaluate the pathogenic role of S. maltophilia in CF patients by using a model of acute respiratory infection in DBA/2 mice following a single exposure to aerosolized bacteria. The pulmonary bacterial load was stable until day 3 and then decreased significantly from day 3 through day 14, when the bacterial load became undetectable in all infected mice. Infection disseminated in most mice, although at a very low level. Severe effects (swollen lungs, large atelectasis, pleural adhesion, and hemorrhages) of lung pathology were observed on days 3, 7, and 14. The clearance of S. maltophilia observed in DBA/2 mouse lungs was clearly associated with an early and intense bronchial and alveolar inflammatory response, which is mediated primarily by neutrophils. Significantly higher levels of interleukin-1beta (IL-1beta), IL-6, IL-12, gamma interferon (IFN-gamma), tumor necrosis factor alpha (TNF-alpha), GROalpha/KC, MCP-1/JE, MCP-5, macrophage inflammatory protein 1alpha (MIP-1alpha), MIP-2, and TARC were observed in infected mice on day 1 with respect to controls. Excessive pulmonary infection and inflammation caused systemic effects, manifested by weight loss, and finally caused a high mortality rate. Taken together, our results show that S. maltophilia is not just a bystander in CF patients but has the potential to contribute to the inflammatory process that compromises respiratory function.
Figures
Similar articles
-
Immunostimulatory properties of the emerging pathogen Stenotrophomonas maltophilia.Infect Immun. 2007 Apr;75(4):1698-703. doi: 10.1128/IAI.01469-06. Epub 2007 Jan 12. Infect Immun. 2007. PMID: 17220304 Free PMC article.
-
Stenotrophomonas maltophilia virulence and specific variations in trace elements during acute lung infection: implications in cystic fibrosis.PLoS One. 2014 Feb 28;9(2):e88769. doi: 10.1371/journal.pone.0088769. eCollection 2014. PLoS One. 2014. PMID: 24586389 Free PMC article.
-
Stenotrophomonas maltophilia mutant lacking flagella remains virulent in DBA/2N mice but is less efficient in stimulating TNF-α expression.FEMS Microbiol Lett. 2018 Oct 1;365(19). doi: 10.1093/femsle/fny205. FEMS Microbiol Lett. 2018. PMID: 30124833
-
Stenotrophomonas maltophilia: to be or not to be a cystic fibrosis pathogen.Curr Opin Pulm Med. 2012 Nov;18(6):628-31. doi: 10.1097/MCP.0b013e328358d4f8. Curr Opin Pulm Med. 2012. PMID: 22990659 Review.
-
Harnessing Neutrophil Survival Mechanisms during Chronic Infection by Pseudomonas aeruginosa: Novel Therapeutic Targets to Dampen Inflammation in Cystic Fibrosis.Front Cell Infect Microbiol. 2017 Jun 30;7:243. doi: 10.3389/fcimb.2017.00243. eCollection 2017. Front Cell Infect Microbiol. 2017. PMID: 28713772 Free PMC article. Review.
Cited by
-
Type II Secretion-Dependent Degradative and Cytotoxic Activities Mediated by Stenotrophomonas maltophilia Serine Proteases StmPr1 and StmPr2.Infect Immun. 2015 Oct;83(10):3825-37. doi: 10.1128/IAI.00672-15. Epub 2015 Jul 13. Infect Immun. 2015. PMID: 26169274 Free PMC article.
-
Genetic susceptibility to toxicologic lung responses among inbred mouse strains following exposure to carbon nanotubes and profiling of underlying gene networks.Toxicol Appl Pharmacol. 2017 Jul 15;327:59-70. doi: 10.1016/j.taap.2017.04.019. Epub 2017 Apr 19. Toxicol Appl Pharmacol. 2017. PMID: 28433707 Free PMC article.
-
A guide to Stenotrophomonas maltophilia virulence capabilities, as we currently understand them.Front Cell Infect Microbiol. 2024 Jan 11;13:1322853. doi: 10.3389/fcimb.2023.1322853. eCollection 2023. Front Cell Infect Microbiol. 2024. PMID: 38274738 Free PMC article. Review.
-
The opportunistic pathogen Stenotrophomonas maltophilia utilizes a type IV secretion system for interbacterial killing.PLoS Pathog. 2019 Sep 12;15(9):e1007651. doi: 10.1371/journal.ppat.1007651. eCollection 2019 Sep. PLoS Pathog. 2019. PMID: 31513674 Free PMC article.
-
Cooperative pathogenicity in cystic fibrosis: Stenotrophomonas maltophilia modulates Pseudomonas aeruginosa virulence in mixed biofilm.Front Microbiol. 2015 Sep 16;6:951. doi: 10.3389/fmicb.2015.00951. eCollection 2015. Front Microbiol. 2015. PMID: 26441885 Free PMC article.
References
-
- Ballestero, S., I. Virseda, H. Escobar, L. Lucrecia, and F. Baquero. 1995. Stenotrophomonas maltophilia in cystic fibrosis patients. Eur. J. Clin. Microbiol. Infect. Dis. 14:728-779. - PubMed
-
- Balough, K., M. McCubbin, M. Weinberger, W. Smits, R. Ahrens, and R. Fick. 1995. The relationship between infection and inflammation in the early stages of lung disease from cystic fibrosis. Pediatr. Pulmonol. 20:63-70. - PubMed
-
- Belardelli, F. 1995. Role of interferons and other cytokines in the regulation of the immune response. Acta Pathol. Microbiol. Immunol. Scand. 103:161-179. - PubMed
Publication types
MeSH terms
Substances
LinkOut - more resources
Full Text Sources
Medical
Miscellaneous
