. 2010 Jun;78(6):2418-28.
doi: 10.1128/IAI.00170-10. Epub 2010 Mar 22.

Inflammatory cytokine response to Bacillus anthracis peptidoglycan requires phagocytosis and lysosomal trafficking

Affiliations

Inflammatory cytokine response to Bacillus anthracis peptidoglycan requires phagocytosis and lysosomal trafficking

Janaki K Iyer et al. Infect Immun. 2010 Jun.

Abstract

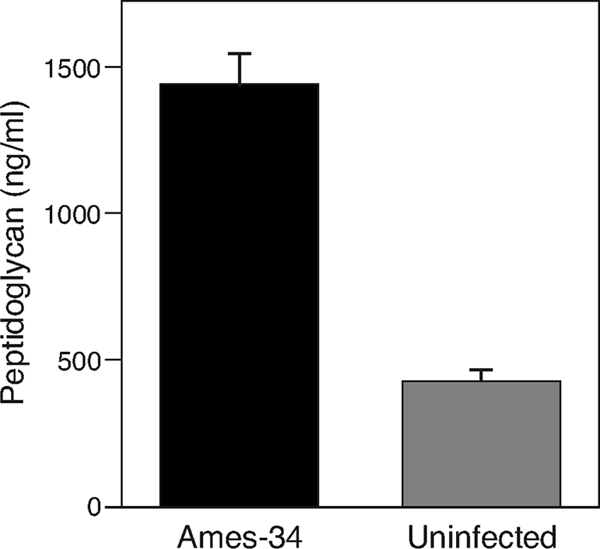
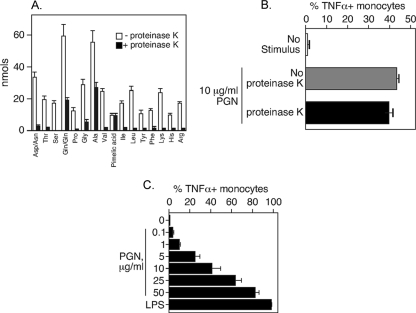
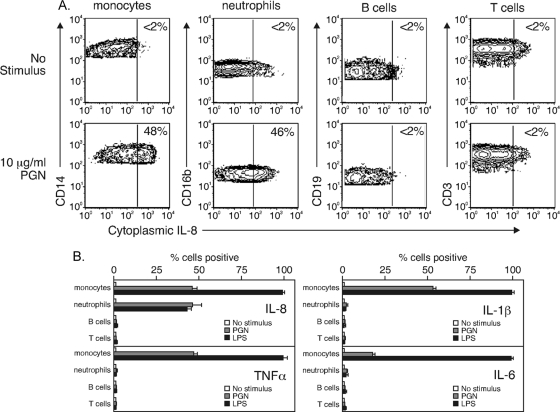
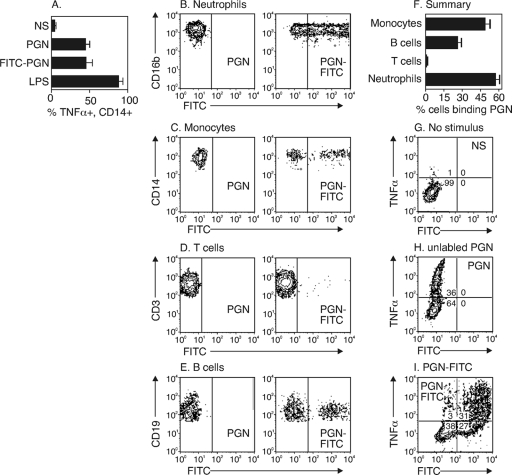
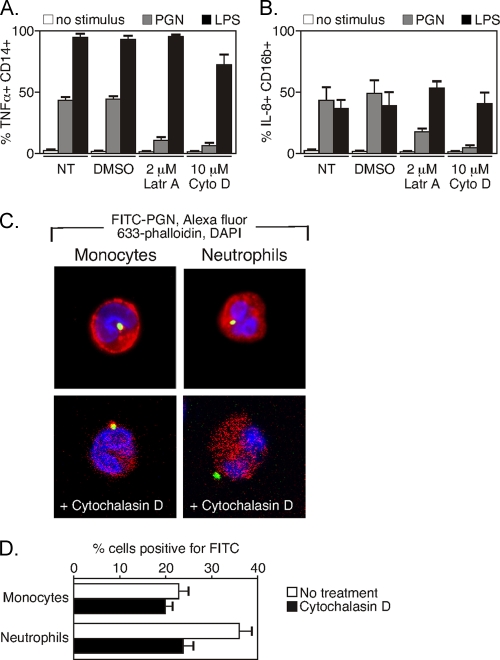
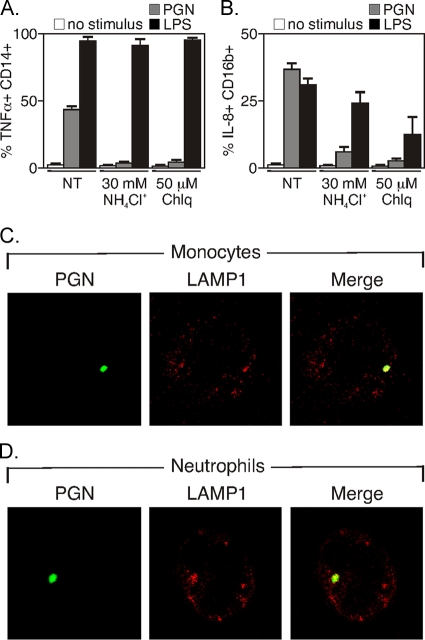
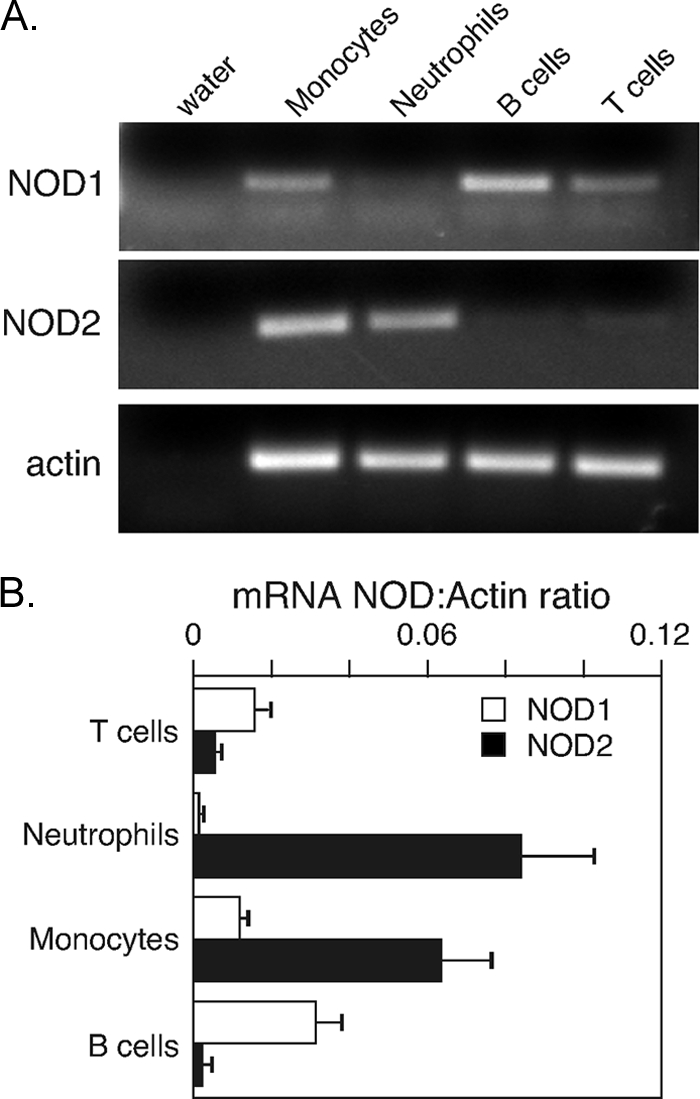
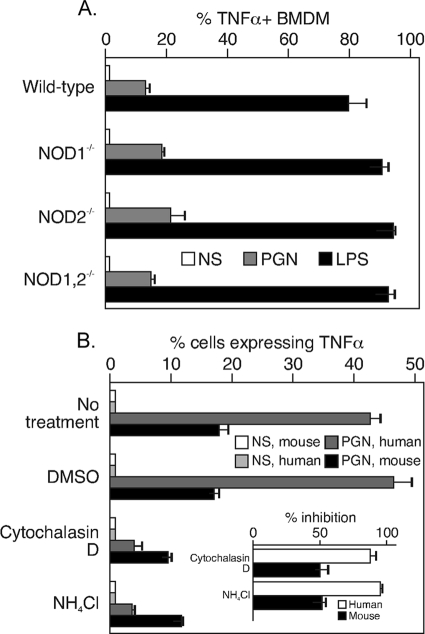
During advanced stages of inhalation anthrax, Bacillus anthracis accumulates at high levels in the bloodstream of the infected host. This bacteremia leads to sepsis during late-stage anthrax; however, the mechanisms through which B. anthracis-derived factors contribute to the pathology of infected hosts are poorly defined. Peptidoglycan, a major component of the cell wall of Gram-positive bacteria, can provoke symptoms of sepsis in animal models. We have previously shown that peptidoglycan of B. anthracis can induce the production of proinflammatory cytokines by cells in human blood. Here, we show that biologically active peptidoglycan is shed from an active culture of encapsulated B. anthracis strain Ames in blood. Peptidoglycan is able to bind to surfaces of responding cells, and internalization of peptidoglycan is required for the production of inflammatory cytokines. We also show that the peptidoglycan traffics to lysosomes, and lysosomal function is required for cytokine production. We conclude that peptidoglycan of B. anthracis is initially bound by an unknown extracellular receptor, is phagocytosed, and traffics to lysosomes, where it is degraded to a product recognized by an intracellular receptor. Binding of the peptidoglycan product to the intracellular receptor causes a proinflammatory response. These findings provide new insight into the mechanism by which B. anthracis triggers sepsis during a critical stage of anthrax disease.


Figures

FIG. 1.
FIG. 1.
PGN is shed into the serum of blood infected with actively growing B. anthracis strain Ames. Defibrinated sheep blood was infected with a single mucoid colony of B. anthracis strain Ames (Ames-34) and incubated at 37°C for 6 h. Following the incubation period, serum was obtained and tested for the presence of PGN by using the silkworm larva plasma test. Serum obtained from uninfected blood was used as a negative control (Uninfected). The data are the averages and standard errors of triplicate samples, and the entire experiment was repeated twice.
FIG. 2.
FIG. 2.
PGN that is treated with proteinase K can induce TNF-α production. (A) PGN was subjected to HF treatment followed by proteinase K digestion. The amino acid content was analyzed prior to (−proteinase K) and following (+proteinase K) proteinase K digestion. The data are representative of the data from three independent experiments. Except for the amino acids alanine, tyrosine, and pimelic acid, there were statistically significant reductions in the amounts of the amino acids following proteinase K digestion (P < 0.05). (B) PB was stimulated with undigested PGN (No proteinase K) or with PGN digested with 10 μg/ml proteinase K (proteinase K) for 6 h. Different cell populations were identified using surface markers. TNF-α production was measured by intracellular cytokine staining and flow cytometry. The data are the averages of three independent experiments performed using three different donors. (C) PB was treated with various doses of PGN or LPS for 6 h. TNF-α production in monocytes was measured by intracellular cytokine staining and flow cytometry. The data are the averages of three independent experiments performed using three different donors.
FIG. 3.
FIG. 3.
PGN can induce the production of TNF-α, IL-6, and IL-1β in monocytes and the production of IL-8 in monocytes and neutrophils. (A) PB was treated with 10 μg/ml of PGN (lower panels) for 6 h. Monocytes, neutrophils, B lymphocytes, and T lymphocytes were identified using cell surface markers. IL-8 production was determined by flow cytometry after intracellular cytokine staining. (B) The percentages of WBC expressing IL-8, IL-1β, TNF-α, and IL-6 following treatment with PGN or LPS were determined by flow cytometry after intracellular cytokine staining. The data are data from three independent experiments performed using three different donors. There were statistically significant (P < 0.05) increases in the percentages of monocytes that were positive for TNF-α, IL-6, and IL-1β production following PGN and LPS treatment, while both monocytes and neutrophils showed statistically significant increases in the percentage of cells positive for IL-8.
FIG. 4.
FIG. 4.
FITC-labeled PGN (FITC-PGN) can bind to monocytes, neutrophils, and B lymphocytes. (A) PB was treated with 10 μg/ml of PGN, PGN-FITC, or LPS for 6 h. TNF-α production in monocytes (CD14+ cells) was measured by intracellular staining and flow cytometry. The data are data from three different donors. There were statistically significant (P < 0.05) increases in the percentages of monocytes that were positive for TNF-α following treatment with PGN, PGN-FITC, or LPS compared to the unstimulated samples (NS). However, there was not a significant difference (P > 0.05) between the percentage of monocytes positive for TNF-α treated with PGN and the percentage of monocytes positive for TNF-α treated with PGN-FITC. (B to E) PB was treated with 10 μg/ml of PGN or PGN-FITC for 30 min. Monocytes, neutrophils, B lymphocytes, and T lymphocytes (C, B, E, and D, respectively) were identified using cell surface markers, and binding of PGN-FITC to the cells was measured by flow cytometry. (F) Percentages of cells that bound to PGN-FITC. The data are data from three independent experiments performed using three different donors. There were significant increases in the percentages of monocytes, neutrophils, and B lymphocytes positive for PGN-FITC binding compared to the results for cells treated with unlabeled PGN. (G to I) PB was not treated (G) or was treated with PGN (H) or PGN-FITC (I) for 6 h. TNF-α production in monocytes that bound to PGN-FITC was measured by intracellular cytokine staining and flow cytometry.
FIG. 5.
FIG. 5.
TNF-α and IL-8 production in monocytes and neutrophils following PGN treatment requires internalization of PGN. (A) PB was pretreated with dimethyl sulfoxide (DMSO), 2 μM latrunculin A (Latr A), or 10 μM cytochalasin D (Cyto D) for 30 min, which was followed by no treatment (no stimulus) or by treatment with PGN or LPS for 6 h. TNF-α production in monocytes (CD14+ cells) was measured by intracellular staining and flow cytometry. The data are data from three independent experiments performed with three different donors. There was a statistically significant (P < 0.05) decrease in the percentage of monocytes expressing TNF-α following PGN treatment in the presence of cytochalasin D or latrunculin A. Such a decrease was not observed following treatment with LPS. NT, no pretreatment. (B) IL-8 production in neutrophils (CD16b+ cells) was measured by intracellular staining and flow cytometry following treatment with PGN or LPS in the presence of cytochalasin D or latrunculin A. The data are data from three independent experiments performed with three different donors. There was a statistically significant (P < 0.05) decrease in the percentage of neutrophils expressing IL-8 following PGN treatment in the presence of cytochalasin D or latrunculin A. Such a decrease was not observed following treatment with LPS. (C) PB was treated with PGN-FITC (green) for 30 min at 37°C in the presence or absence of cytochalasin D. The cell populations indicated were identified using cell surface markers and were sorted using flow cytometry. Cells were fixed, permeabilized, and stained with phalloidin (red) and DAPI (blue). Internalization of PGN-FITC was observed by using optical sectioning. One optical section is shown. (D) PB was treated with PGN-FITC in the presence or absence of cytochalasin D for 30 min at 37°C. The percentages of monocytes and neutrophils that bound to PGN-FITC were determined by flow cytometry. The data shown are representative data from three independent experiments performed using three different donors.
FIG. 6.
FIG. 6.
TNF-α and IL-8 production in monocytes and neutrophils following PGN treatment is inhibited in the presence of lysosomotropic agents. (A) PB was pretreated with 30 mM ammonium chloride (NH4Cl) or 50 μM chloroquine (Chlq) for 30 min, which was followed by no treatment (no stimulus), PGN treatment, or LPS treatment for 6 h. TNF-α production in monocytes (CD14+ cells) was measured by intracellular staining and flow cytometry. The data are data from three independent experiments performed with three different donors. There was a statistically significant (P < 0.05) decrease in the percentage of monocytes expressing TNF-α following PGN treatment in the presence of ammonium chloride or chloroquine. Such a decrease was not observed following treatment with LPS. NT, no pretreatment. (B) IL-8 production in neutrophils (CD16b+ cells) was measured by intracellular staining and flow cytometry following treatment with PGN or LPS in the presence of ammonium chloride or chloroquine. The data are data from three independent experiments performed using three different donors. There was a statistically significant (P < 0.05) decrease in the percentage of neutrophils expressing IL-8 following PGN treatment in the presence of ammonium chloride or chloroquine. A significant decrease was also observed following treatment with LPS in the presence of chloroquine but not in the presence of ammonium chloride. (C and D) PB was treated with PGN-FITC (green) for 60 min at 37°C. Monocytes (C) and neutrophils (D) were identified by unique cell surface markers and were sorted using flow cytometry. Cells were fixed, permeabilized, and stained with LAMP1 antibody (red). Colocalization of PGN-FITC and LAMP1 was observed using a confocal microscope by using optical sectioning. One optical section is shown.
FIG. 7.
FIG. 7.
Differential expression of NOD1 and NOD2 mRNA was observed in WBC. Purified populations of monocytes, neutrophils, B lymphocytes, and T lymphocytes were obtained by cell sorting. cDNA was synthesized from total RNA and subjected to PCR amplification using primers specific for actin, NOD1, and NOD2. The PCR mixtures were run on a 1% agarose gel containing ethidium bromide (A). (B) Semiquantitative real-time PCR was also performed with the cDNA to determine the levels of expression of NOD1 and NOD2 in various WBC populations. The data are data from three independent experiments performed using three different donors. There were statistically significant (P < 0.05) lower levels of NOD1 mRNA in monocytes and neutrophils than in lymphocytes. Conversely, there were statistically significant elevated levels of NOD2 mRNA in monocytes and neutrophils compared to lymphocytes.
FIG. 8.
FIG. 8.
Mouse bone marrow-derived macrophages signal differently than human monocytes. (A) TNF-α production was evaluated by flow cytometry using mouse BMDM (obtained from wild-type, NOD1−/−, NOD2−/−, and NOD1−/− NOD2−/− mice) that were treated with 10 μg/ml PGN or 1 μg/ml LPS for 6 h or were not treated (NS). The data are data from two independent experiments performed in duplicate. There was a statistically significant (P < 0.05) increase in the percentage of BMDM expressing TNF-α following treatment with PGN or LPS compared to the results for the unstimulated samples. (B) Mouse BMDM or human monocytes were treated with PGN in the presence or absence of DMSO, cytochalasin D, or ammonium chloride (NH4Cl). TNF-α production was measured by intracellular cytokine staining and flow cytometry. The data are data from three independent experiments. The data in panel B were analyzed to evaluate the percent reductions in the number of human monocytes or mouse BMDM expressing TNF-α following treatment with PGN in the presence of cytochalasin D or ammonium chloride (inset). There was a statistically significant (P < 0.05) decrease in the percentage of human monocytes or mouse BMDM expressing TNF-α following PGN treatment in the presence of cytochalasin D or ammonium chloride.

References

    1. Baldari, C. T., F. Tonello, S. R. Paccani, and C. Montecucco. 2006. Anthrax toxins: a paradigm of bacterial immune suppression. Trends Immunol. 27:434-440. - PubMed
    1. Biswas, S. K., and E. Lopez-Collazo. 2009. Endotoxin tolerance: new mechanisms, molecules and clinical significance. Trends Immunol. 30:475-487. - PubMed
    1. Chaloupka, J., and P. Kreckova. 1971. Turnover of mucopeptide during the life cycle of Bacillus megaterium. Folia Microbiol. (Praha) 16:372-382. - PubMed
    1. Chamaillard, M., M. Hashimoto, Y. Horie, J. Masumoto, S. Qiu, L. Saab, Y. Ogura, A. Kawasaki, K. Fukase, S. Kusumoto, M. A. Valvano, S. J. Foster, T. W. Mak, G. Nunez, and N. Inohara. 2003. An essential role for NOD1 in host recognition of bacterial peptidoglycan containing diaminopimelic acid. Nat. Immunol. 4:702-707. - PubMed
    1. Chau, T. A., M. L. McCully, W. Brintnell, G. An, K. J. Kasper, E. D. Vines, P. Kubes, S. M. Haeryfar, J. K. McCormick, E. Cairns, D. E. Heinrichs, and J. Madrenas. 2009. Toll-like receptor 2 ligands on the staphylococcal cell wall downregulate superantigen-induced T cell activation and prevent toxic shock syndrome. Nat. Med. 15:641-648. - PubMed

Publication types

LinkOut - more resources