

Normal human monocytes exposed to glioma cells acquire myeloid-derived suppressor cell-like properties
- PMID: 20308313
- PMCID: PMC2940603
- DOI: 10.1093/neuonc/nop023
Normal human monocytes exposed to glioma cells acquire myeloid-derived suppressor cell-like properties
Abstract
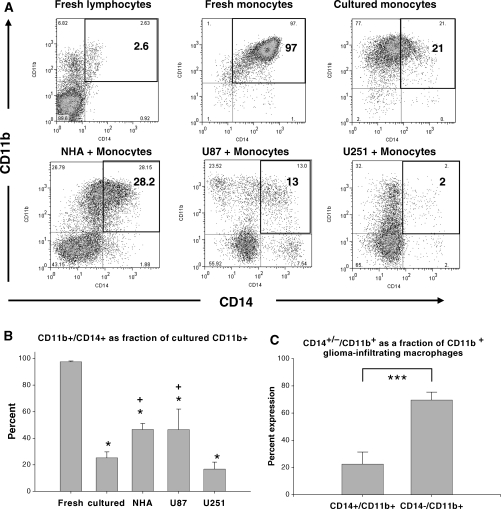
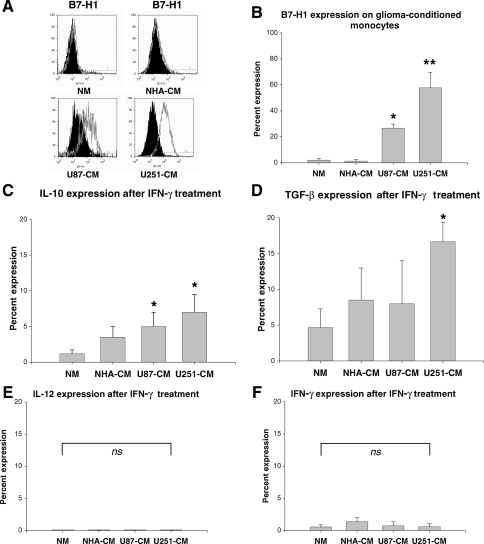
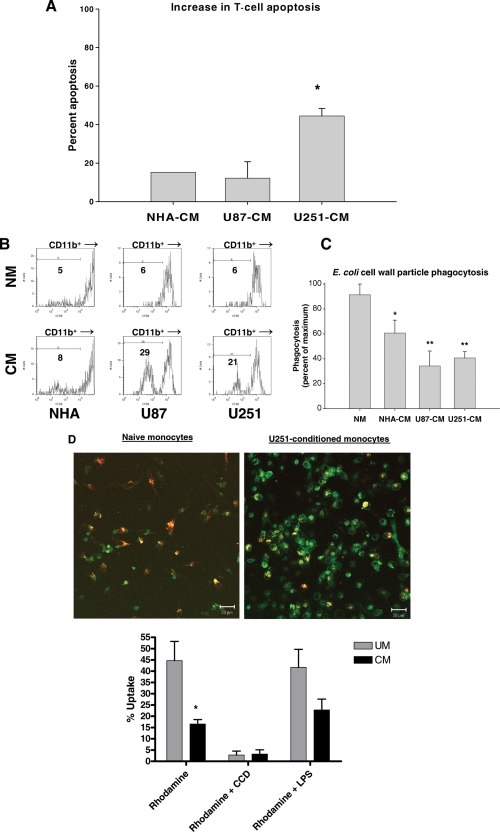
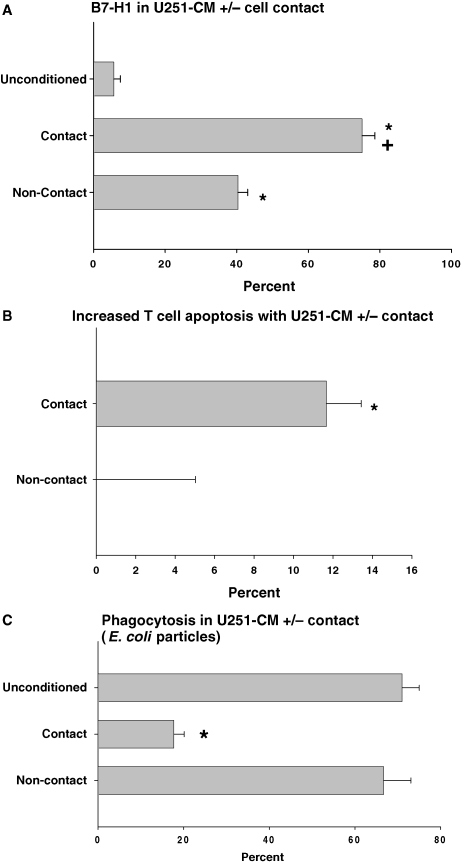
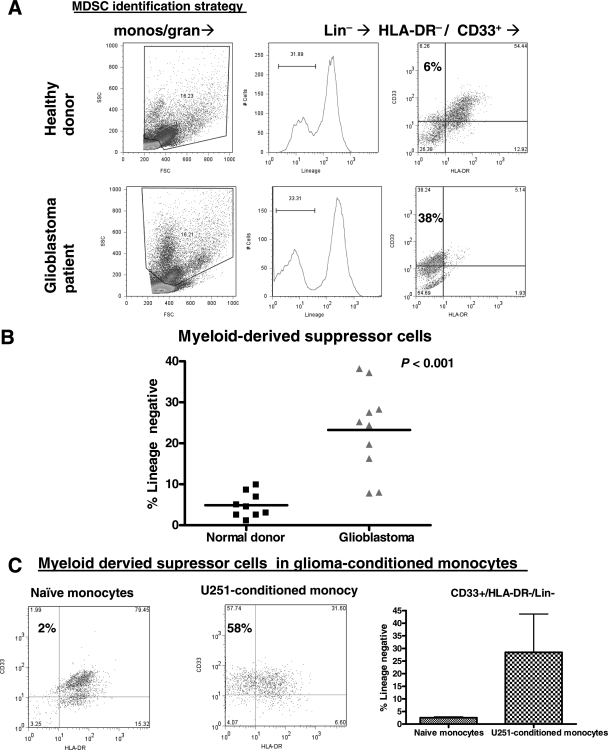
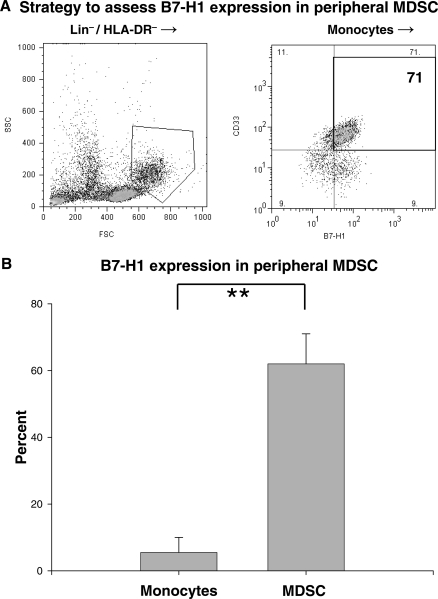
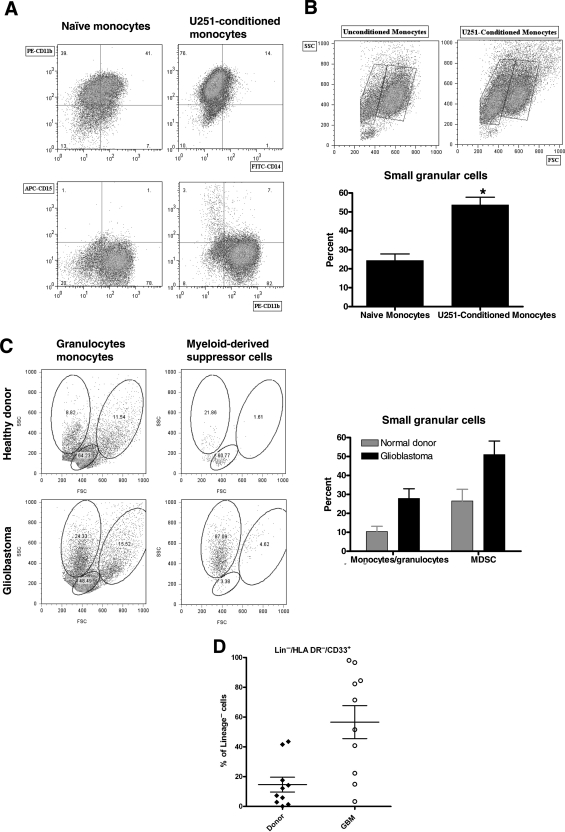
Glioblastoma patients are immunosuppressed, yet glioblastomas are highly infiltrated by monocytes/macrophages. Myeloid-derived suppressor cells (MDSC; immunosuppressive myeloid cells including monocytes) have been identified in other cancers and correlate with tumor burden. We hypothesized that glioblastoma exposure causes normal monocytes to assume an MDSC-like phenotype and that MDSC are increased in glioblastoma patients. Healthy donor human CD14(+) monocytes were cultured with human glioblastoma cell lines. Controls were cultured alone or with normal human astrocytes. After 48 hours, glioblastoma-conditioned monocytes (GCM) were purified using magnetic beads. GCM cytokine and costimulatory molecular expression, phagocytic ability, and ability to induce apoptosis in activated lymphocytes were assessed. The frequency of MDSC was assessed by flow cytometry in glioma patients' blood and in GCM in vitro. As predicted, GCM have immunosuppressive, MDSC-like features, including reduced CD14 (but not CD11b) expression, increased immunosuppressive interleukin-10, transforming growth factor-beta, and B7-H1 expression, decreased phagocytic ability, and increased ability to induce apoptosis in activated lymphocytes. Direct contact between monocytes and glioblastoma cells is necessary for complete induction of these effects. In keeping with our hypothesis, glioblastoma patients have increased circulating MDSC compared with normal donors and MDSC are increased in glioma-conditioned monocytes in vitro. To our knowledge, this has not been reported previously. Although further study is needed to directly characterize their origin and function in glioblastoma patients, these results suggest that MDSC may be an important contributor to systemic immunosuppression and can be modeled in vitro by GCM.
Figures
Comment in
-
Immunotherapy for glioblastoma: a long and winding road.Neuro Oncol. 2010 Apr;12(4):319. doi: 10.1093/neuonc/noq027. Neuro Oncol. 2010. PMID: 20308309 Free PMC article. No abstract available.
Similar articles
-
Modulating glioma-mediated myeloid-derived suppressor cell development with sulforaphane.PLoS One. 2017 Jun 30;12(6):e0179012. doi: 10.1371/journal.pone.0179012. eCollection 2017. PLoS One. 2017. PMID: 28666020 Free PMC article.
-
Myeloid-derived suppressor cell measurements in fresh and cryopreserved blood samples.J Immunol Methods. 2012 Jul 31;381(1-2):14-22. doi: 10.1016/j.jim.2012.04.004. Epub 2012 Apr 13. J Immunol Methods. 2012. PMID: 22522114 Free PMC article.
-
Functional characterization of human Cd33+ and Cd11b+ myeloid-derived suppressor cell subsets induced from peripheral blood mononuclear cells co-cultured with a diverse set of human tumor cell lines.J Transl Med. 2011 Jun 9;9:90. doi: 10.1186/1479-5876-9-90. J Transl Med. 2011. PMID: 21658270 Free PMC article.
-
Myeloid-derived suppressors cells (MDSC) correlate with clinicopathologic factors and pathologic complete response (pCR) in patients with urothelial carcinoma (UC) undergoing cystectomy.Urol Oncol. 2018 Sep;36(9):405-412. doi: 10.1016/j.urolonc.2018.02.018. Epub 2018 Mar 30. Urol Oncol. 2018. PMID: 29606341 Review.
-
Myeloid-derived suppressor cells (MDSCs) in brain cancer: challenges and therapeutic strategies.Inflammopharmacology. 2021 Dec;29(6):1613-1624. doi: 10.1007/s10787-021-00878-9. Epub 2021 Oct 6. Inflammopharmacology. 2021. PMID: 34613567 Review.
Cited by
-
Increasing glioma-associated monocytes leads to increased intratumoral and systemic myeloid-derived suppressor cells in a murine model.Neuro Oncol. 2015 Jul;17(7):978-91. doi: 10.1093/neuonc/nou343. Epub 2014 Dec 23. Neuro Oncol. 2015. PMID: 25537019 Free PMC article.
-
Mechanisms of immune suppression by myeloid-derived suppressor cells: the role of interleukin-10 as a key immunoregulatory cytokine.Open Biol. 2020 Sep;10(9):200111. doi: 10.1098/rsob.200111. Epub 2020 Sep 16. Open Biol. 2020. PMID: 32931721 Free PMC article. Review.
-
On the origin of myeloid-derived suppressor cells.Oncotarget. 2017 Jan 10;8(2):3649-3665. doi: 10.18632/oncotarget.12278. Oncotarget. 2017. PMID: 27690299 Free PMC article. Review.
-
Characterization of the immune microenvironment of diffuse intrinsic pontine glioma: implications for development of immunotherapy.Neuro Oncol. 2019 Jan 1;21(1):83-94. doi: 10.1093/neuonc/noy145. Neuro Oncol. 2019. PMID: 30169876 Free PMC article.
-
Short non-coding RNA sequencing of glioblastoma extracellular vesicles.J Neurooncol. 2020 Jan;146(2):253-263. doi: 10.1007/s11060-019-03384-9. Epub 2020 Jan 7. J Neurooncol. 2020. PMID: 31912278
References
-
- Holland EC. Progenitor cells and glioma formation. Curr Opin Neurol. 2001;14:683–688. - PubMed
-
- Ohgaki H, Kleihues P. Epidemiology and etiology of gliomas. Acta Neuropathol (Berl). 2005;109:93–108. - PubMed
-
- Liau LM, Black KL, Prins RM, et al. Treatment of intracranial gliomas with bone marrow-derived dendritic cells pulsed with tumor antigens. J Neurosurg. 1999;90:1115–1124. - PubMed
-
- Parney IF, Petruk KC, Zhang C, et al. GM-CSF and B7-2 combination immunogene therapy in an allogeneic hu-PBL-SCID/beige mouse—human glioblastoma multiforme model. Hum Gene Ther. 1997;8:1073–1085. - PubMed
Publication types
MeSH terms
Substances
Grants and funding
LinkOut - more resources
Full Text Sources
Other Literature Sources
Medical
Research Materials
