

Intra-tumoral dendritic cells increase efficacy of peripheral vaccination by modulation of glioma microenvironment
- PMID: 20308315
- PMCID: PMC2940598
- DOI: 10.1093/neuonc/nop024
Intra-tumoral dendritic cells increase efficacy of peripheral vaccination by modulation of glioma microenvironment
Abstract
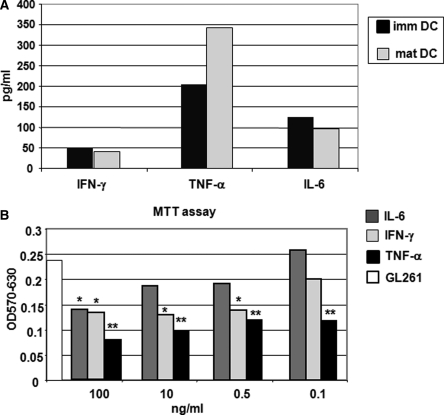
Pilot data showed that adding intratumoral (IT) injection of dendritic cells (DCs) prolongs survival of patients affected by glioblastoma multiforme (GBM) treated by subcutaneous (SC) delivery of DCs. Using a murine model resembling GBM, we investigated the immunological mechanisms underlying this effect. C57BL6/N mice received brain injections of GL261 glioma cells. Seven days later, mice were treated by 3 SC injections of DCs with or without 1 IT injection of DCs. DC maturation, induced by pulsing with GL261 lysates, was necessary to develop effective immune responses. IT injection of pulsed (pDC), but not unpulsed DCs (uDC), increased significantly the survival, either per se or in combination with SC-pDC (P < .001 vs controls). Mice treated by IT-pDC plus SC-pDC survived longer than mice treated by SC-pDC only (P = .03). Injected pDC were detectable in tumor parenchyma, but not in cervical lymph nodes. In gliomas injected with IT-pDC, CD8+ cells were significantly more abundant and Foxp3+ cells were significantly less abundant than in other groups. Using real-time polymerase chain reaction, we also found enhanced expression of IFN-gamma and TNF-alpha and decreased expression of transforming growth factor-beta (TGF-beta) and Foxp3 in mice treated with SC-pDC and IT-pDC. In vitro, pDC produced more TNF-alpha than uDC: addition of TNF-alpha to the medium decreased the proliferation of glioma cells. Overall, the results suggest that IT-pDC potentiates the anti-tumor immune response elicited by SC-pDC by pro-immune modulation of cytokines in the tumor microenvironment, decrease of Treg cells, and direct inhibition of tumor proliferation by TNF-alpha.
Figures


Similar articles
-
An experimental study of dendritic cells-mediated immunotherapy against intracranial gliomas in rats.J Neurooncol. 2005 Aug;74(1):9-17. doi: 10.1007/s11060-004-3339-x. J Neurooncol. 2005. PMID: 16078102
-
Sequential delivery of interferon-alpha gene and DCs to intracranial gliomas promotes an effective antitumor response.Gene Ther. 2004 Nov;11(21):1551-8. doi: 10.1038/sj.gt.3302300. Gene Ther. 2004. PMID: 15343358
-
DC vaccination with anti-CD25 treatment leads to long-term immunity against experimental glioma.Neuro Oncol. 2009 Oct;11(5):529-42. doi: 10.1215/15228517-2009-004. Epub 2009 Mar 31. Neuro Oncol. 2009. PMID: 19336528 Free PMC article.
-
Dendritic cell gene therapy.Surg Oncol Clin N Am. 2002 Jul;11(3):645-60. doi: 10.1016/s1055-3207(02)00027-3. Surg Oncol Clin N Am. 2002. PMID: 12487060 Review.
-
Clinical efficacy of tumor antigen-pulsed DC treatment for high-grade glioma patients: evidence from a meta-analysis.PLoS One. 2014 Sep 12;9(9):e107173. doi: 10.1371/journal.pone.0107173. eCollection 2014. PLoS One. 2014. PMID: 25215607 Free PMC article.
Cited by
-
The multidrug-resistance transporter Abcc3 protects NK cells from chemotherapy in a murine model of malignant glioma.Oncoimmunology. 2015 Oct 29;5(5):e1108513. doi: 10.1080/2162402X.2015.1108513. eCollection 2016 May. Oncoimmunology. 2015. PMID: 27467914 Free PMC article.
-
Acyclovir inhibition of IDO to decrease Tregs as a glioblastoma treatment adjunct.J Neuroinflammation. 2010 Aug 6;7:44. doi: 10.1186/1742-2094-7-44. J Neuroinflammation. 2010. PMID: 20691089 Free PMC article.
-
Molecular alterations in glioblastoma: potential targets for immunotherapy.Prog Mol Biol Transl Sci. 2011;98:187-234. doi: 10.1016/B978-0-12-385506-0.00005-3. Prog Mol Biol Transl Sci. 2011. PMID: 21199773 Free PMC article. Review.
-
Interaction network of immune-associated genes affecting the prognosis of patients with glioblastoma.Exp Ther Med. 2021 Jan;21(1):61. doi: 10.3892/etm.2020.9493. Epub 2020 Nov 19. Exp Ther Med. 2021. PMID: 33365061 Free PMC article.
-
Peritumoral administration of DRibbles-pulsed antigen-presenting cells enhances the antitumor efficacy of anti-GITR and anti-PD-1 antibodies via an antigen presenting independent mechanism.J Immunother Cancer. 2019 Nov 20;7(1):311. doi: 10.1186/s40425-019-0786-7. J Immunother Cancer. 2019. PMID: 31747946 Free PMC article.
References
-
- Palucka AK, Ueno H, Fay JW, Banchereau J. Taming cancer by inducing immunity via dendritic cells. Immunol Rev. 2007;220:129–150. - PubMed
-
- Gajewski TF, Meng Y, Blank C, et al. Immune resistance orchestrated by the tumor microenvironment. Immunol Rev. 2006;213(1):131–145. - PubMed
-
- de Vleeschouwer S, Rapp M, Sorg RV, et al. Dendritic cell vaccination in patients with malignant gliomas: current status and future directions. Neurosurgery. 2006;59(5):988–999. discussion 999–1000. - PubMed
-
- Hussain SF, Heimberger AB. Immunotherapy for human glioma: innovative approaches and recent results. Expert Rev Anticancer Ther. 2005;5(5):777–790. - PubMed
Publication types
MeSH terms
Substances
LinkOut - more resources
Full Text Sources
Medical
Research Materials
