. 2010 Jun;333(3):736-47.
doi: 10.1124/jpet.110.166884. Epub 2010 Mar 22.

Protection against acute kidney injury via A(1) adenosine receptor-mediated Akt activation reduces liver injury after liver ischemia and reperfusion in mice

Affiliations

Protection against acute kidney injury via A(1) adenosine receptor-mediated Akt activation reduces liver injury after liver ischemia and reperfusion in mice

Sang Won Park et al. J Pharmacol Exp Ther. 2010 Jun.

Abstract

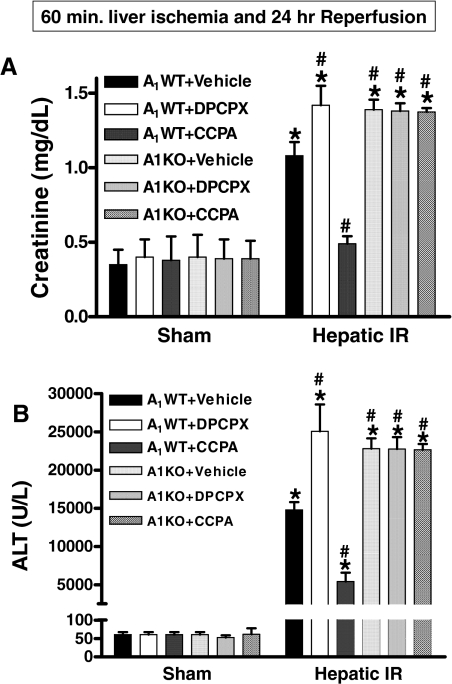
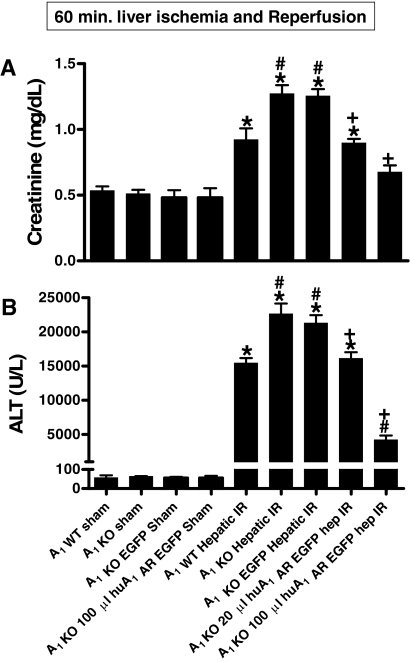
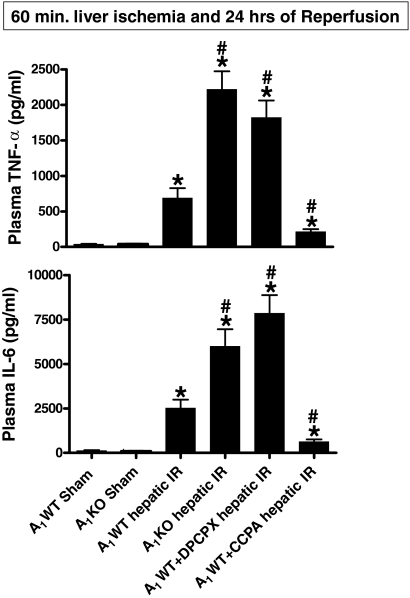
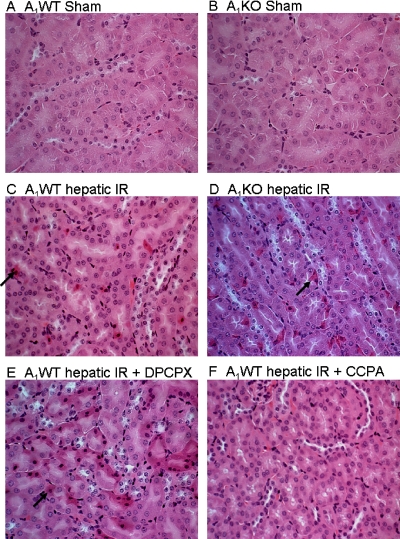
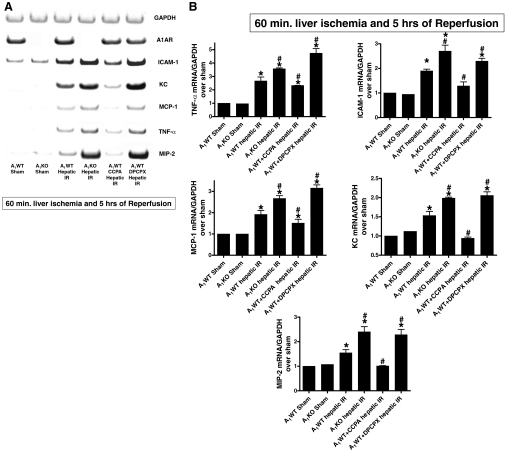
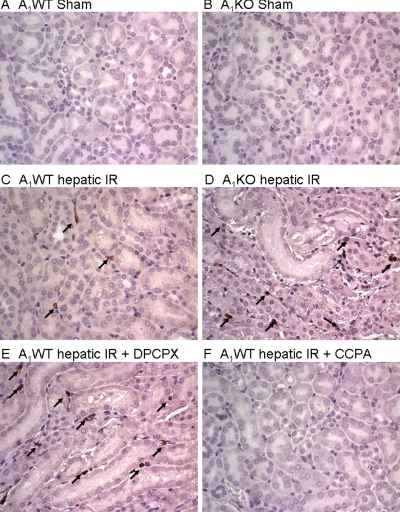
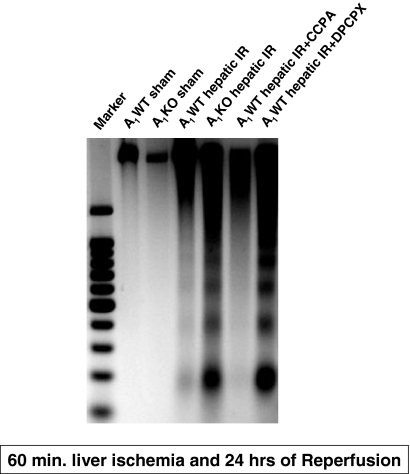
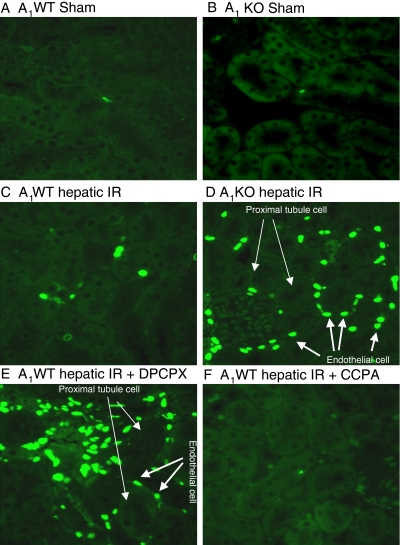
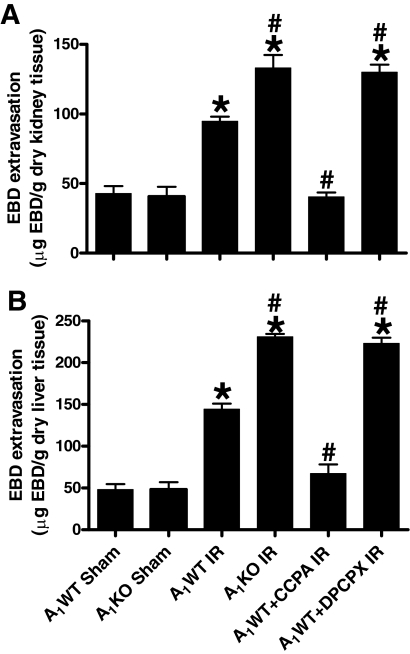
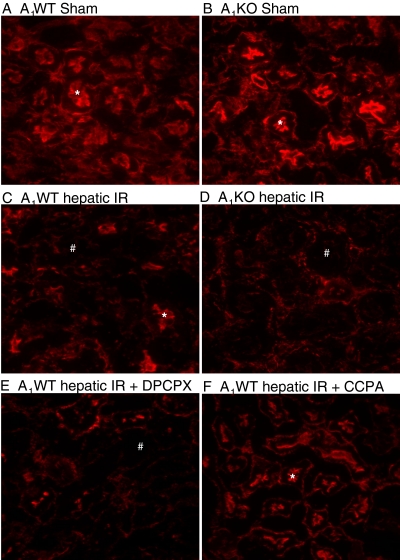
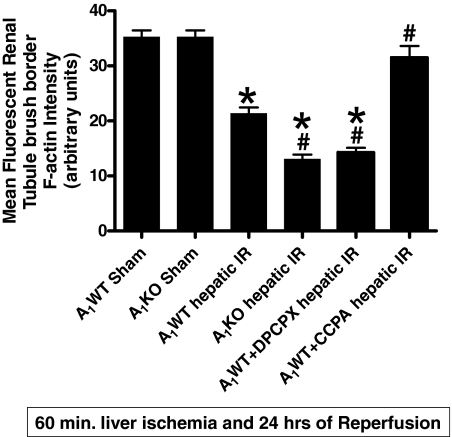
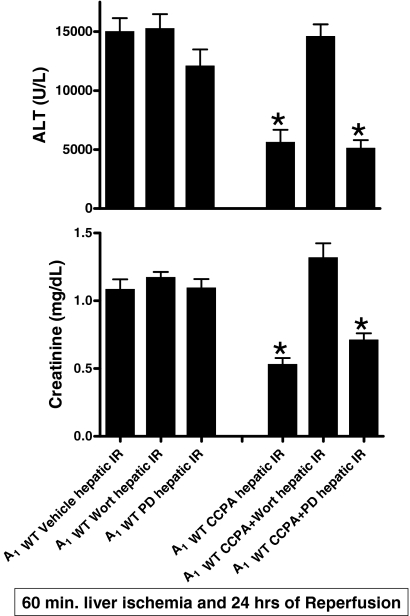
Hepatic ischemia reperfusion (IR) injury causes acute kidney injury (AKI). However, the contribution of AKI to the pathogenesis of liver IR injury is unclear. Furthermore, controversy still exists regarding the role of A(1) adenosine receptors (A(1)ARs) in AKI. In this study, we determined whether exogenous and endogenous A(1)AR activation protects against AKI with subsequent liver protection after hepatic IR in mice. We found that after hepatic IR A(1) knockout (KO) mice and A(1)AR antagonist-treated A(1) wild-type (WT) mice developed worse AKI and liver injury compared with vehicle-treated A(1)WT mice. Moreover, a selective A(1)AR agonist protected against hepatic IR-induced AKI and liver injury in A(1)WT mice. Renal A(1)AR-mediated kidney protection plays a crucial role in protecting the liver after IR because: 1) selective unilateral renal lentiviral overexpression of human A(1)ARs [enhanced green fluorescent protein (EGFP)-huA(1)AR] in A(1)KO mice protected against both kidney and liver injury sustained after liver IR, 2) removal of the EGFP-huA(1)AR lentivirus-injected kidney from A(1)KO mice abolished both renal and hepatic protection after liver IR, and 3) bilateral nephrectomy before hepatic ischemia abolished the protective effects of A(1)AR activation in A(1)WT mice. Finally, inhibition of Akt, but not extracellular signal-regulated kinase mitogen-activated protein kinase, prevented the kidney and liver protection afforded by A(1)AR agonist treatment. Taken together, we show that endogenous and exogenous activation of renal A(1)ARs protect against liver and kidney injury after liver IR in vivo via pathways involving Akt activation.


Figures

Fig. 1.
Fig. 1.
Comparison of mean plasma creatinine (A) and ALT activity (B) measured from sham-operated and vehicle-treated A1WT mice (n = 4) and A1KO mice (n = 4), sham-operated A1WT mice given injections of 0.1 mg/kg CCPA (n = 4) or 0.4 mg/kg DPCPX (n = 4), A1WT mice (n = 6–10) or A1KO mice (n = 6–10) pretreated with vehicle, and A1WT mice (n = 6–9) or A1KO mice (n = 6) pretreated with DPCPX or CCPA and subjected to liver IR. Plasma creatinine and ALT activity were measured at 24 h after reperfusion for each mouse. *, P < 0.05 versus A1WT or A1KO sham group. #, P < 0.05 versus A1WT+vehicle hepatic IR group. Error bars represent 1 S.E.M.
Fig. 2.
Fig. 2.
Comparison of mean plasma creatinine (A; mg/dl) and ALT activity (B; U/liter) measured from sham-operated A1WT mice (n = 4) and A1KO mice (n = 4), sham-operated A1KO mice renally injected with EGFP-encoding lentivirus (100 μl, n = 5), A1WT mice (n = 6) or A1KO mice (n = 6) subjected to hepatic IR, and A1KO mice renally injected with EGFP (n = 5) or EGFP-huA1AR mice encoding lentivirus (20 or 100 μl, n = 5 each) and subjected to hepatic IR. Mice were renally injected with lentivirus 48 h before sham surgery or hepatic IR. Plasma ALT and creatinine was measured at 24 h after reperfusion. *, P < 0.05 versus sham-operated mice. #, P < 0.05 versus A1WT mice subjected to liver IR. +, P < 0.05 versus A1KO mice injected with EGFP lentivirus. Error bars represent 1 S.E.M.
Fig. 3.
Fig. 3.
Plasma TNF-α (top) and IL-6 levels (bottom) (in pg/ml) in sham-operated A1WT mice (A1WT sham, n = 4) and A1KO mice (A1KO sham, n = 4), A1WT mice (A1WT hepatic IR, n = 6) or A1KO mice (A1KO hepatic IR, n = 5–8) subjected to 60 min of hepatic ischemia and 24 h of reperfusion, and A1WT mice pretreated with 0.4 mg/kg DPCPX (A1WT hepatic IR+DPCPX, n = 5–8) or 0.1 mg/kg CCPA (A1WT hepatic IR+CCPA, n = 5) and subjected to 60 of min hepatic ischemia and 24 h of reperfusion. Data are presented as means ± S.E.M. *, P < 0.05 versus A1WT or A1KO sham group. #, P < 0.01 versus A1WT hepatic IR group.
Fig. 4.
Fig. 4.
Representative (four to five slides) hematoxylin and eosin-stained photomicrographs (magnification: 400×) in kidney sections from sham-operated A1WT (A1WT sham; A) and A1KO mice (A1KO sham; B), A1WT (A1WT hepatic IR; C), or A1KO mice (A1KO hepatic IR; D) subjected to 60 min of liver ischemia and 24 h of reperfusion, and A1WT mice pretreated with 0.4 mg/kg DPCPX (A1WT hepatic IR+DPCPX; E) or 0.1 mg/kg CCPA (A1WT hepatic IR+CCPA; F) and subjected to 60 min of liver ischemia and 24 h of reperfusion (magnification 400×, cortico-medullary junction). Hypereosinophilic proximal tubules (arrows) visible in A1WT mice subjected to liver IR are increased in A1KO mice or DPCPX-treated A1WT mice subjected to liver IR.
Fig. 5.
Fig. 5.
A, representative gel images of semiquantitative RT-PCR results for GAPDH, murine A1AR, TNF-α, ICAM-1, KC, MCP-1, and MIP-2 mRNAs of kidney tissues from sham-operated A1WT and A1KO mice (A1WT sham, n = 3; A1KO sham, n = 3), A1WT or A1KO mice subjected to 60 min of hepatic ischemia and 5 h of reperfusion (A1WT hepatic IR, n = 6; A1KO hepatic IR, n = 5), and A1WT mice pretreated with 0.4 mg/kg DPCPX (A1WT hepatic IR+DPCPX, n = 5) or 0.1 mg/kg CCPA (A1WT hepatic IR+CCPA, n = 5) and subjected to 60 min of hepatic ischemia and 5 h of reperfusion. B, densitometric quantification of relative proinflammatory mRNA band intensities normalized to GAPDH from RT-PCRs. Data are presented as means ± S.E.M. *, P < 0.05 versus A1WT or A1KO sham group. #, P < 0.05 versus A1WT hepatic IR group.
Fig. 6.
Fig. 6.
Representative photomicrographs (three to five experiments) of immunohistochemistry for neutrophils (arrows indicating brown granules) in kidney (400×) sections from sham-operated A1WT mice (A1WT sham; A) and A1KO mice (A1KO sham; B), A1WT (A1WT hepatic IR; C) or A1KO (A1KO hepatic IR; D) subjected to 60 min of hepatic ischemia and 24 h of reperfusion, and A1WT mice pretreated with 0.4 mg/kg DPCPX (A1WT hepatic IR+DPCPX; E) or 0.1 mg/kg CCPA (A1WT hepatic IR+CCPA; F) and subjected to 60 min of hepatic ischemia and 24 h of reperfusion.
Fig. 7.
Fig. 7.
Representative gel images (of four experiments) demonstrating DNA laddering as an index of DNA fragmentation in the kidney tissues from sham-operated A1WT (A1WT sham) and A1KO mice (A1KO sham), A1WT (A1WT hepatic IR) or A1KO mice (A1KO hepatic IR) subjected to 60 min of hepatic ischemia and 24 h of reperfusion, and A1WT mice pretreated with 0.4 mg/kg DPCPX (A1WT hepatic IR+DPCPX) or 0.1 mg/kg CCPA (A1WT hepatic IR+CCPA) and subjected to 60 min of hepatic ischemia and 24 h of reperfusion. Apoptotic DNA fragments were extracted according to the methods of Herrmann et al. (1994). This method of DNA extraction selectively isolates apoptotic, fragmented DNA and leaves behind the intact chromatin.
Fig. 8.
Fig. 8.
Representative fluorescent photomicrographs (of four experiments) illustrate apoptotic nuclei (TUNEL fluorescent stain; magnification 400×) in kidney sections from sham-operated A1WT mice (A1WT sham; A) and A1KO mice (A1KO sham; B), A1WT mice (A1WT hepatic IR; C) or A1KO mice (A1KO hepatic IR, D) subjected to 60 min of hepatic ischemia and 24 h of reperfusion, and A1WT mice pretreated with 0.4 mg/kg DPCPX (A1WT hepatic IR+DPCPX; E) or 0.1 mg/kg CCPA (A1WT hepatic IR+CCPA; F) and subjected to 60 min of hepatic ischemia and 24 h of reperfusion. In the kidney, endothelial cells predominantly underwent apoptotic death (short, thick arrows) with sparing of renal proximal tubule cells (long, thin arrows) as illustrated in Fig. 6D.
Fig. 9.
Fig. 9.
Quantification of EBD extravasations as indices of vascular permeability of kidney (A) and liver (B) tissues from sham-operated A1WT mice (A1WT sham, n = 4) and A1KO mice (A1KO sham, n = 4), A1WT mice (A1WT hepatic IR, n = 7) or A1KO mice (A1KO hepatic IR, n = 7) subjected to 60 min of hepatic ischemia and 5 h of reperfusion, and A1WT mice pretreated with 0.4 mg/kg DPCPX (A1WT hepatic IR+DPCPX, n = 6) or 0.1 mg/kg CCPA (A1WT hepatic IR+CCPA, n = 6) and subjected to 60 min of hepatic ischemia and 5 h of reperfusion. Data are presented as means ± S.E.M. *, P < 0.05 versus A1WT or A1KO sham group. #, P < 0.05 versus A1WT hepatic IR group.
Fig. 10.
Fig. 10.
Representative fluorescent photomicrographs (of four experiments) of phalloidin staining of the kidney tissues (magnification: 400×) from sham-operated A1WT mice (A1WT sham; A) and A1KO mice (A1KO sham; B), A1WT mice (A1WT hepatic IR; C) or A1KO mice (A1KO hepatic IR; D) subjected to 60 min of hepatic ischemia and 24 h of reperfusion, and A1WT mice pretreated with 0.4 mg/kg DPCPX (A1WT hepatic IR+DPCPX; E) or 0.1 mg/kg CCPA (A1WT hepatic IR+CCPA; F) and subjected to 60 min of hepatic ischemia and 24 h of reperfusion. In the kidney, F-actin stains of proximal tubular epithelial cells are prominent in the brush border from sham-operated mice (*), which is severely degraded in the kidneys of mice subjected to liver IR (#).
Fig. 11.
Fig. 11.
Quantification of mean renal proximal tubule F-actin intensity in kidney tissues from sham-operated A1WT mice (A1WT sham) and A1KO mice (A1KO sham), A1WT mice (A1WT hepatic IR) or A1KO mice (A1KO hepatic IR) subjected to 60 min of hepatic ischemia and 24 h of reperfusion, and A1WT mice pretreated with 0.4 mg/kg DPCPX (A1WT hepatic IR+DPCPX) or 0.1 mg/kg CCPA (A1WT hepatic IR+CCPA) and subjected to 60 min of hepatic ischemia and 24 h of reperfusion. *, P < 0.05 versus A1WT or A1KO sham group. #, P < 0.05 versus A1WT hepatic IR group.
Fig. 12.
Fig. 12.
Plasma creatinine (top; mg/dL) and ALT activity (bottom; U/liter) in A1WT mice after injection with vehicle (A1WT Vehicle hepatic IR) or 0.1 mg/kg CCPA 15 min (A1WT CCPA hepatic IR) before 60 min of hepatic ischemia and 24 h of reperfusion. Some A1WT mice were pretreated with PD98059 (PD, an inhibitor of MEK1 to inhibit ERK phosphorylation, 1 mg/kg i.p.) or wortmannin (an inhibitor of PI3K to inhibit Akt phosphorylation, 1 mg/kg i.p.) 15 min before vehicle [A1WT Wort hepatic IR (n = 5) or A1WT PD hepatic IR (n = 5)] or CCPA treatment [A1WT CCPA+Wort hepatic IR (n = 5) or A1WT CCPA+PD hepatic IR (n = 5)]. Data are presented as means ± S.E.M. Inhibition of PI3K → Akt pathway but not MEK → ERK MAPK prevents acute A1AR activation-induced renal protection after hepatic IR. *, P < 0.05 versus A1WT Vehicle hepatic IR group.

References

    1. Awad AS, Ye H, Huang L, Li L, Foss FW, Jr, Macdonald TL, Lynch KR, Okusa MD. (2006) Selective sphingosine 1-phosphate 1 receptor activation reduces ischemia-reperfusion injury in mouse kidney. Am J Physiol Renal Physiol 290:F1516–F1524 - PubMed
    1. Betrosian AP, Agarwal B, Douzinas EE. (2007) Acute renal dysfunction in liver diseases. World J Gastroenterol 13:5552–5559 - PMC - PubMed
    1. Bidani AK, Churchill PC. (1983) Aminophylline ameliorates glycerol-induced acute renal failure in rats. Can J Physiol Pharmacol 61:567–571 - PubMed
    1. Bowmer CJ, Collis MG, Yates MS. (1986) Effect of the adenosine antagonist 8-phenyltheophylline on glycerol-induced acute renal failure in the rat. Br J Pharmacol 88:205–212 - PMC - PubMed
    1. Buckley S, Driscoll B, Barsky L, Weinberg K, Anderson K, Warburton D. (1999) ERK activation protects against DNA damage and apoptosis in hyperoxic rat AEC2. Am J Physiol Lung Cell Mol Physiol 277:L159–L166 - PubMed

Publication types

MeSH terms