. 2010 Apr 12;207(4):689-97.
doi: 10.1084/jem.20092642. Epub 2010 Mar 22.

Lymph node fibroblastic reticular cells directly present peripheral tissue antigen under steady-state and inflammatory conditions

Affiliations

Lymph node fibroblastic reticular cells directly present peripheral tissue antigen under steady-state and inflammatory conditions

Anne L Fletcher et al. J Exp Med. .

Abstract

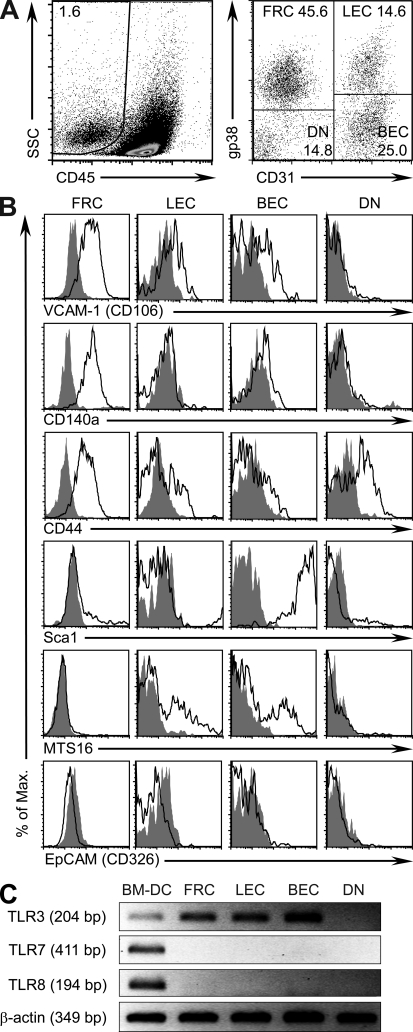
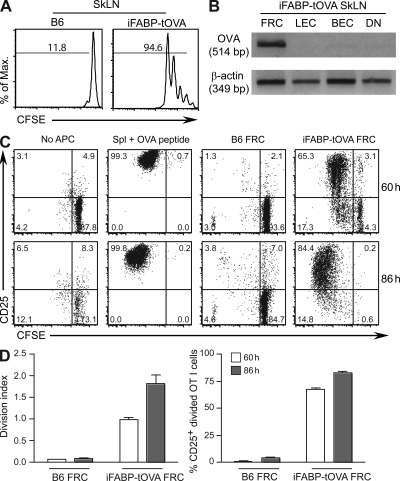
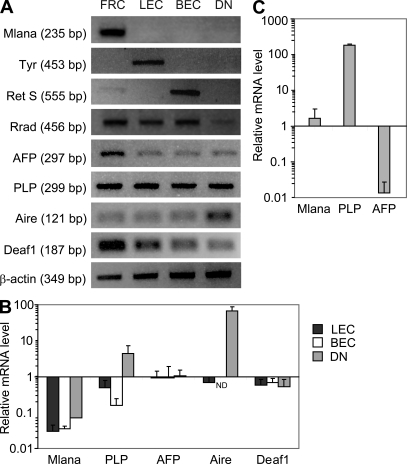
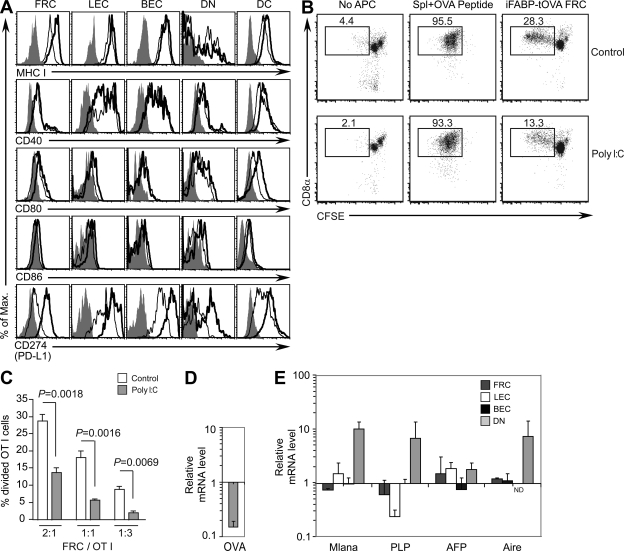
Lymph node stromal cells (LNSCs) can induce potent, antigen-specific T cell tolerance under steady-state conditions. Although expression of various peripheral tissue-restricted antigens (PTAs) and presentation to naive CD8+ T cells has been demonstrated, the stromal subsets responsible have not been identified. We report that fibroblastic reticular cells (FRCs), which reside in the T cell zone of the LN, ectopically express and directly present a model PTA to naive T cells, inducing their proliferation. However, we found that no single LNSC subset was responsible for PTA expression; rather, each subset had its own characteristic antigen display. Studies to date have concentrated on PTA presentation under steady-state conditions; however, because LNs are frequently inflammatory sites, we assessed whether inflammation altered stromal cell-T cell interactions. Strikingly, FRCs showed reduced stimulation of T cells after Toll-like receptor 3 ligation. We also characterize an LNSC subset expressing the highest levels of autoimmune regulator, which responds potently to bystander inflammation by up-regulating PTA expression. Collectively, these data show that diverse stromal cell types have evolved to constitutively express PTAs, and that exposure to viral products alters the interaction between T cells and LNSCs.


Figures

Figure 1.
Figure 1.
LNSC subsets are phenotypically distinct. (A) Flow cytometric strategy used to identify and sort CD45 LNSC subsets according to gp38 and CD31 expression. The percentage of CD45 stroma (left) and LNSC subsets (right) is shown. (B) LNSC subsets were analyzed using flow cytometry. Shading indicates isotype control. Data represent five to six mice from three experiments. (C) TLR expression in sorted LNSC subsets assessed by RT-PCR. Images represent three experiments. BM-DC, bone marrow–derived DC; SSC, side scatter.
Figure 2.
Figure 2.
FRCs ectopically express and present OVA to OT-I T cells. (A) CFSE-labeled OT-I T cells were transferred into B6 or iFABP-tOVA hosts. T cell division, measured as the percentage of CFSE dilution, was assessed by flow cytometry. Graphs represent 12 mice from four experiments. (B) OVA transcription was assessed by RT-PCR. β-Actin was used to demonstrate cDNA integrity. Images are representative of three experiments. (C) Proliferation of CFSE-labeled OT-I T cells (shown as the percentage divided) was assessed after culture alone, with SIINFEKL-pulsed splenocytes, or with FRCs purified from C57BL/6 or iFABP-tOVA mice. Plots represent three experiments. (D) The cell division index (left) and proportion of divided cells (right) were calculated from three experiments. Graphs depict means + SD. SkLN, skin-draining LN.
Figure 3.
Figure 3.
LNSC subsets show distinct PTA expression patterns. (A) RT-PCR was performed for a panel of PTAs. Images represent two to four experiments. (B) QPCR was performed for selected PTAs and transcriptional regulators. (C) QPCR was used to examine PTA expression in primary tissue compared with FRCs (normalized to 1, relative to GAPDH). All QPCR data show expression calculated relative to GAPDH and are depicted as fold change relative to FRCs, normalized to 1. All graphs depict means + SD from three to four experiments. ND, not detected; Ret S, retinal S antigen.
Figure 4.
Figure 4.
Activation through TLR3 alters LNSC phenotype and reduces FRC-mediated T cell stimulation. (A) LNSC expression of co-stimulatory and inhibitory receptors was assessed by flow cytometry. Plots represent six to seven mice from two to three experiments. Shading indicates isotype control; thin and thick lines depict data from PBS- or PolyI:C-treated mice, respectively. (B) Proliferation of CFSE-labeled OT-I T cells (shown as percentage divided) with and without PolyI:C. Cells were cultured without APCs, with SIINFEKL-pulsed splenocytes, or with FRCs purified from iFABP-tOVA mice. Plots represent three experiments. (C) OT I cell division was calculated across FRC/T cell dilutions. Graph depicts mean + SD from three experiments. (D) OVA expression levels in FRCs were assessed by QPCR after PolyI:C or PBS treatment of iFABP-tOVA mice. Graph depicts mean + SD from three experiments. (E) QPCR was performed for selected PTAs. Graph depicts mean + SD from two to three experiments. For all QPCR data, expression in PolyI:C-treated mice was calculated relative to GAPDH and depicted as fold change relative to expression in the appropriate subset from PBS-injected mice, normalized to 1. ND, not detected.

Comment in

References

    1. Anderson M.S., Venanzi E.S., Klein L., Chen Z., Berzins S.P., Turley S.J., von Boehmer H., Bronson R., Dierich A., Benoist C., Mathis D. 2002. Projection of an immunological self shadow within the thymus by the aire protein. Science. 298:1395–1401 10.1126/science.1075958 - DOI - PubMed
    1. Bajénoff M., Egen J.G., Koo L.Y., Laugier J.P., Brau F., Glaichenhaus N., Germain R.N. 2006. Stromal cell networks regulate lymphocyte entry, migration, and territoriality in lymph nodes. Immunity. 25:989–1001 10.1016/j.immuni.2006.10.011 - DOI - PMC - PubMed
    1. Bonyadi M., Waldman S.D., Liu D., Aubin J.E., Grynpas M.D., Stanford W.L. 2003. Mesenchymal progenitor self-renewal deficiency leads to age-dependent osteoporosis in Sca-1/Ly-6A null mice. Proc. Natl. Acad. Sci. USA. 100:5840–5845 10.1073/pnas.1036475100 - DOI - PMC - PubMed
    1. Cario E., Rosenberg I.M., Brandwein S.L., Beck P.L., Reinecker H.C., Podolsky D.K. 2000. Lipopolysaccharide activates distinct signaling pathways in intestinal epithelial cell lines expressing Toll-like receptors. J. Immunol. 164:966–972 - PubMed
    1. Derbinski J., Schulte A., Kyewski B., Klein L. 2001. Promiscuous gene expression in medullary thymic epithelial cells mirrors the peripheral self. Nat. Immunol. 2:1032–1039 10.1038/ni723 - DOI - PubMed

Publication types

MeSH terms