. 2010 Mar 22;188(6):877-90.
doi: 10.1083/jcb.200906012.

Myosin II activity regulates vinculin recruitment to focal adhesions through FAK-mediated paxillin phosphorylation

Affiliations

Myosin II activity regulates vinculin recruitment to focal adhesions through FAK-mediated paxillin phosphorylation

Ana M Pasapera et al. J Cell Biol. .

Abstract

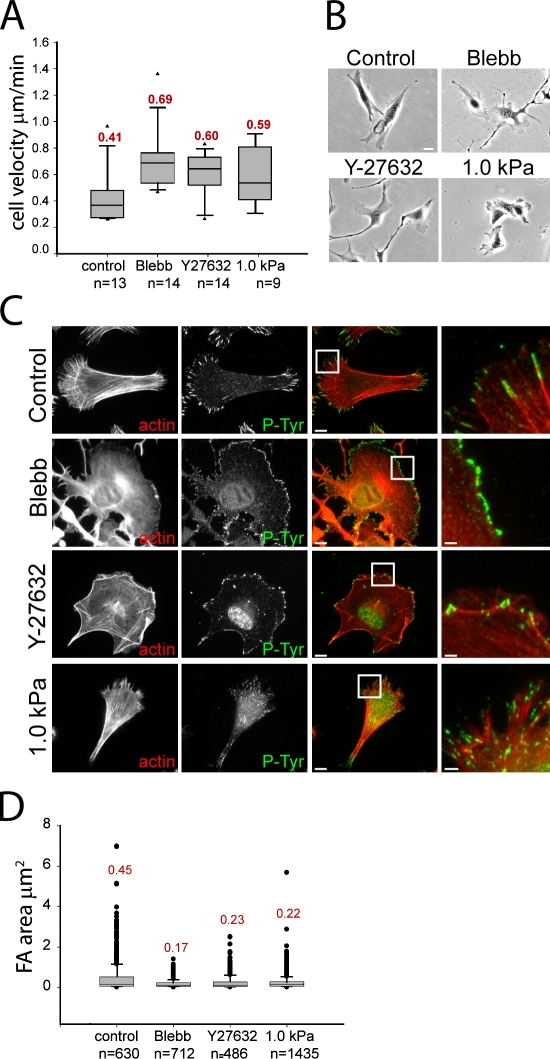
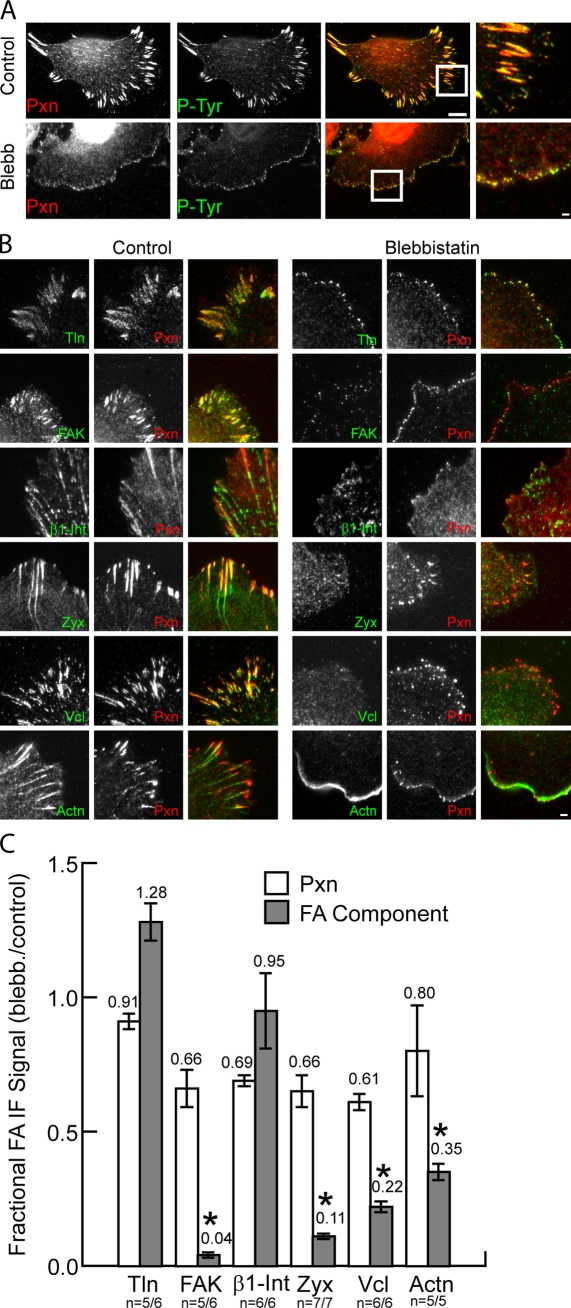
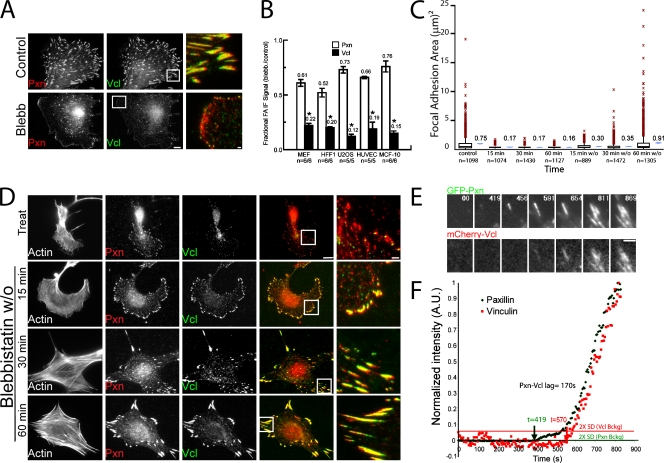
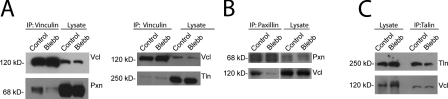
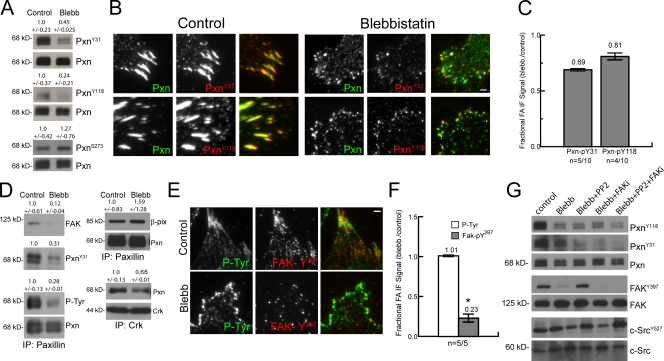
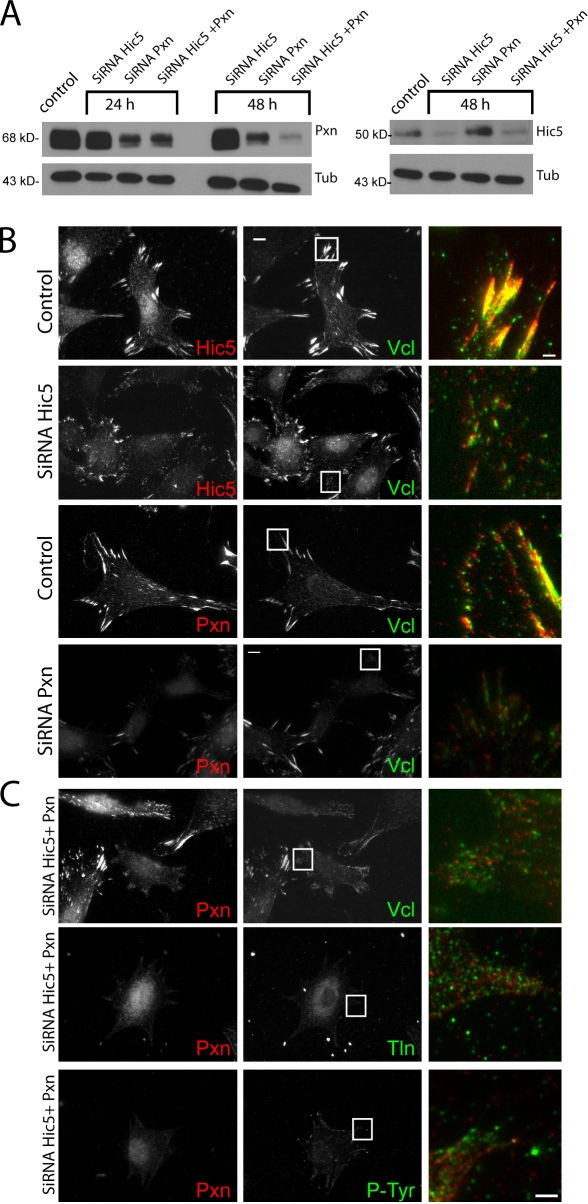
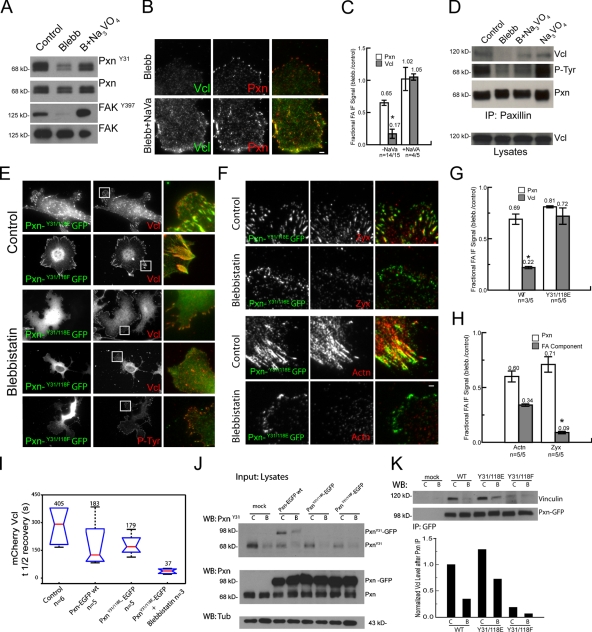
Focal adhesions (FAs) are mechanosensitive adhesion and signaling complexes that grow and change composition in response to myosin II-mediated cytoskeletal tension in a process known as FA maturation. To understand tension-mediated FA maturation, we sought to identify proteins that are recruited to FAs in a myosin II-dependent manner and to examine the mechanism for their myosin II-sensitive FA association. We find that FA recruitment of both the cytoskeletal adapter protein vinculin and the tyrosine kinase FA kinase (FAK) are myosin II and extracellular matrix (ECM) stiffness dependent. Myosin II activity promotes FAK/Src-mediated phosphorylation of paxillin on tyrosines 31 and 118 and vinculin association with paxillin. We show that phosphomimic mutations of paxillin can specifically induce the recruitment of vinculin to adhesions independent of myosin II activity. These results reveal an important role for paxillin in adhesion mechanosensing via myosin II-mediated FAK phosphorylation of paxillin that promotes vinculin FA recruitment to reinforce the cytoskeletal ECM linkage and drive FA maturation.


Figures

Figure 1.
Figure 1.
Rho kinase–mediated myosin II activity and substrate stiffness slow MEF migration and increase adhesion size. (A) Migration rates for untreated cells (control), cells treated with 20 µM blebbistatin (Blebb) or 10 µM Y27632, or plated on 1.0 kPa compliant polyacrylamide substrates. Mean velocity is shown above each box plot. Arrowheads indicate lower and upper extreme outliers. n = number of cells. (B) Phase-contrast images of cell morphology under the same conditions as in A. Bar, 10 µm. (C) Immunolocalization of PY epitopes (P-Tyr) to visualize adhesions (green) and fluorescent phalloidin staining to visualize actin filaments (red) under the treatments as in A. Merged images are shown in the third column, and boxed regions are magnified in the fourth column. Bars: (third column) 10 µm; (fourth column) 2 µm. (D) Area of individual adhesions within PY-immunolabeled cells under the conditions in A. Mean adhesion area (micrometer squared) is shown above each box plot. n = number of adhesions.
Figure 2.
Figure 2.
Myosin II is required for recruitment of specific proteins to adhesions. (A) Immunolocalization of paxillin (Pxn; red) and PY epitopes (P-Tyr; green) in untreated cells (control) or cells treated with 20 µM blebbistatin (Blebb). Merged images are shown in the third column, and boxed regions are magnified in the fourth column. Bars: (third column) 10 µm; (fourth column) 2 µm. (B) Immunolocalization of paxillin (red) with either (in green); talin 1 (Tln), FAK, β1 integrin (β1-Int), zyxin (Zyx), vinculin (Vcl), or α-actinin (Actn) in untreated control cells (left) or cells treated with 20 µM blebbistatin (right). Merged images are shown in the right column. Bar, 2 µm. (C) Effects of blebbistatin on adhesion localization of FA proteins expressed as the ratio of mean fluorescence intensities within segmented adhesions of blebbistatin-treated relative to control cells. Mean ratios are shown above each plot. *, P < 0.02. Error bars indicate 95% confidence interval of the mean. n = number of blebbistatin-treated cells/number of control cells.
Figure 3.
Figure 3.
Vinculin is stably bound in adhesions. EGFP fusion proteins localized to adhesions were subjected to FRAP. (A) Sample fluorescence recovery curves for vinculin, α-actinin, talin 1, paxillin, FAK, and zyxin in single adhesions. Note different x-axis scales in left and right plots; fits are shown as solid lines. (B) Half-times of fluorescence recovery. Means are shown above each plot. Vcl, vinculin; Actn, α-actinin; Pxn, paxillin; Tln, talin 1; Zyx, zyxin. n = number of adhesions.
Figure 4.
Figure 4.
Characterization of myosin II dependence of vinculin recruitment to adhesions. (A) Immunolocalization in human foreskin fibroblasts (HFF1) of vinculin (Vcl; green) and paxillin (Pxn; red) in untreated (control) or 20 µM blebbistatin (Blebb)-treated cells. Bar, 10 µm. Merged, magnified images of boxed regions are shown in the third column. Bar, 2 µm. n = number of blebbistatin-treated cells/number of control cells. (B) Effects of blebbistatin on adhesion localization of paxillin and vinculin in the noted cell types expressed as the ratio of mean fluorescence intensities within segmented adhesions of blebbistatin-treated relative to control cells. Mean ratios are shown above each plot. *, P < 0.02. Error bars indicate 95% confidence interval of the mean. (C) Area of individual adhesions from paxillin immunostaining in MEF cells in untreated control cells at specific times after treatment with 20 µM blebbistatin (15, 30, and 60 min) or washout of 20 µM blebbistatin into control media (15, 30, and 60 min w/o). Mean adhesion areas (micrometer squared) are shown next to each box plot. Red symbols indicate the outliers at more than three interquartiles; blue symbols indicate a −95% confidence interval of the mean. n = number of adhesions. (D) Immunolocalization of paxillin (red) and vinculin (green) and fluorescent phalloidin staining of actin filaments in cells after treatment (Treat) for 60 min and washout (blebbistatin w/o) for 15, 30, and 60 min of 20 µM blebbistatin. Merged images are shown in the fourth column, and boxed regions are magnified in the fifth column. Bars: (fourth column) 10 µm; (fifth column) 2 µm. (E) Images from a time-lapse dual-color TIRF series of EGFP-paxillin (GFP-Pxn) and mCherry vinculin (mCherry-Vcl) during adhesion formation and growth in a migrating MEF cell. Time is shown in seconds. Bar, 2 µm. (F) Normalized fluorescent protein intensity (green, paxillin; red, vinculin) in the adhesion shown in E. Horizontal lines show the value of two times the standard deviation of the normalized background fluorescence (2× SD Vcl or Pxn Bckg); note that this is higher for mCherry because it is much dimmer than EGFP. Arrows indicate the time when the intensity rose above these values. The time difference between arrows indicates lag time between the accumulation of EGFP-paxillin and mCherry-vinculin at the adhesion (Pxn-Vcl lag).
Figure 5.
Figure 5.
Effects of myosin II inhibition on the interactions between vinculin, paxillin, and talin. IPs were performed from lysates of untreated control MEFs (control) or MEFs treated with 20 µM blebbistatin (Blebb) followed by immunoblot analysis. (A) IP with anti-vinculin (Vcl) antibodies, immunoblot with anti-vinculin and antipaxillin (Pxn; left), or anti–talin 1 (Tln; right) antibodies. (B) IP with antipaxillin antibodies and immunoblotting with antivinculin antibodies. White lines indicate that intervening lanes have been spliced out. (C) IP with anti–talin 1 antibodies and immunoblotting with antivinculin antibodies are shown.
Figure 6.
Figure 6.
Myosin II promotes tyrosine phosphorylation and interaction of paxillin, vinculin, and FAK. (A) Immunoblot of lysates of untreated MEF cells (control) and cells treated with 20 µM blebbistatin (Blebb) using antibodies specific to paxillin (Pxn) or pY31, pY118, or pS273 paxillin (PxnY31, PxnY118, and PxnS273). Numbers above each blot represent the mean of quantified Western blots ± 95% confidence interval (n = 4 experiments). (B) Immunolocalization of paxillin (green) and pY31 or pY118 paxillin (red) in untreated control cells and cells treated with 20 µM blebbistatin. The third columns show merged images Bar, 2 µm. (C) Effects of blebbistatin on adhesion localization of pY31 and pY118 paxillin in adhesions, expressed (also in F) as the ratio of mean fluorescence intensities within segmented adhesions of 20 µM blebbistatin-treated relative to control cells. Antibody competition for similar epitopes precluded comparison with effects of blebbistatin on total paxillin level in the same cells. Mean fluorescence ratio is shown above each plot. n = number of blebbistatin-treated cells/number of control cells (also in F). (D) IP with antibodies to paxillin (left and top right) or Crk (bottom right) from lysates of untreated control MEFs or MEFs treated with 20 µM blebbistatin followed by immunoblotting with antibodies to paxillin, PY epitopes (P-Tyr), pY31 paxillin, FAK, β-Pix, or Crk. Numbers above each blot represent the mean of quantified Western blots ± 95% confidence interval (n = 3 experiments). (E) Immunofluorescence analysis of untreated control cells or cells treated with 20 µM blebbistatin using antibodies specific to pY397 FAK (red) or PY epitopes (green). Merged images are shown in the third column. Bar, 2 µm. (F) Effects of 20 µM blebbistatin on adhesion localization of pY397 FAK and PY in adhesions quantified from immunofluorescence images. *, P < 0.02. (G) Immunoblot of lysates of untreated MEF cells, cells treated with 20 µM blebbistatin, or a combination of 20 µM blebbistatin and either 10 µm PP2, 10 µm PF271 (FAKi), or all three using antibodies specific to paxillin, pY31, pY118 paxillin, FAK, pY397 FAK, Src (c-Src), or pY527 Src (cSrcY527). Error bars indicate 95% confidence interval of the mean.
Figure 7.
Figure 7.
Requirement for paxillin and Hic5 for adhesion formation. (A) Immunoblot analysis of paxillin (Pxn; left), Hic5 (right), and tubulin (Tub; both) in lysates of mock-transfected cells or cells transfected with siRNA pools against paxillin, Hic5, or both. (B) Immunofluorescence localization of Hic5 (red), paxillin (red), and vinculin (Vcl; green) in control cells or cells transfected with siRNA pools against paxillin or Hic5. (C) Immunofluorescence localization of paxillin (red) and vinculin, talin 1 (Tln), or PY epitopes (P-Tyr; green) in control cells or cells transfected with siRNA pools against both paxillin and Hic5. (B and C) Merged images of boxed regions are magnified in third columns. Bars, 2 µm.
Figure 8.
Figure 8.
Paxillin Y31/118 phosphorylation is sufficient for promoting paxillin–vinculin interaction and labile vinculin recruitment to adhesions. (A) Immunoblot analysis of lysates of untreated (control) and cells treated with 20 µM blebbistatin (Blebb) or with 20 µM blebbistatin and 100 µM Na3VO4 using antibodies specific to paxillin (Pxn), pY31 paxillin, pY397FAK, or FAK. (B) Comparison of cells treated with 20 µM blebbistatin or 20 µM blebbistatin and 100 µM Na3VO4 and immunolabeled with antibodies to paxillin (red) and vinculin (Vcl; green). Bar, 2 µm. (C) Effects of Na3VO4 on vinculin localization in adhesions of blebbistatin-treated cells, shown (also in G and H) as the ratio of mean fluorescence intensities within segmented adhesions of 20 µM blebbistatin-treated cells relative to non–blebbistatin-treated cells in the presence and absence of additional Na3VO4. The mean fluorescence ratio is shown above each plot. (D) Antipaxillin IPs from lysates of untreated control or cells treated with either 20 µM blebbistatin, 100 µM Na3VO4, and 20 µM blebbistatin or 100 µM Na3VO4 alone followed by analysis by PAGE and immunoblotting with antibodies to vinculin, paxillin, or PY epitopes. (E–I) EGFP-conjugated paxillin (Pxn-GFP wt) or paxillin bearing mutations of tyrosines 31 and 118 to phenylalanines (Pxn Y31/118F) or glutamic acids (Pxn Y31/118E) were expressed in MEFs and either treated with 20 µM blebbistatin or not. (E) Images of cells expressing EGFP-conjugated paxillin mutants (green) and immunolocalization of vinculin (red) or PY epitopes (P-Tyr; red). Right columns show (also in F) merged, magnified images of the boxed regions Bar, 2 µm. (F) Images of EGFP-conjugated Y31/118E paxillin (green) and immunolocalization of zyxin (Zyx; red) or α-actinin (Actn; red) in cells treated with 20 µM blebbistatin. (G) Effects of blebbistatin on adhesion localization of vinculin and paxillin in cells overexpressing wild type (WT) or mutant (Y31/118E) paxillin-EGFP. (H) Effects of blebbistatin on adhesion localization of zyxin, α-actinin, and paxillin in cells overexpressing Y31/118E paxillin-EGFP. (I) FRAP analysis of mCherry-vinculin. mCherry-vinculin was expressed alone (control) or together with EGFP conjugates of wild-type or Y31/118E paxillin in untreated cells or cells treated with 20 µM blebbistatin (+Blebb), and FRAP was performed of the mCherry vinculin fraction in adhesions. Half-times of mCherry vinculin fluorescence recovery. Means are shown above each plot. n = number of adhesions. (J) Immunoblots of lysates of blebbistatin-treated (B) or untreated (C) cells that had been mock transfected or transfected with the EGFP-paxillin mutants and probed with antibodies to paxillin, pY31 paxillin, or tubulin. (K) Anti-GFP immunoprecipitates from MEFs expressing EGFP-tagged paxillins and either untreated (C) or treated with 20 µM blebbistatin (B) and probed by immunoblotting with antibodies to vinculin and GFP. Quantification of blots is shown below. WB, Western blot. *, P < 0.02. Error bars indicate 95% confidence interval of the mean. (C, G, and H) n = number of blebbistatin-treated cells/number of control cells.

Similar articles

Cited by

References

    1. Ballestrem C., Erez N., Kirchner J., Kam Z., Bershadsky A., Geiger B. 2006. Molecular mapping of tyrosine-phosphorylated proteins in focal adhesions using fluorescence resonance energy transfer. J. Cell Sci. 119:866–875 10.1242/jcs.02794 - DOI - PubMed
    1. Bellis S.L., Miller J.T., Turner C.E. 1995. Characterization of tyrosine phosphorylation of paxillin in vitro by focal adhesion kinase. J. Biol. Chem. 270:17437–17441 10.1074/jbc.270.29.17437 - DOI - PubMed
    1. Bertolucci C.M., Guibao C.D., Zheng J.J. 2008. Phosphorylation of paxillin LD4 destabilizes helix formation and inhibits binding to focal adhesion kinase. Biochemistry. 47:548–554 10.1021/bi702103n - DOI - PMC - PubMed
    1. Brown M.C., Perrotta J.A., Turner C.E. 1996. Identification of LIM3 as the principal determinant of paxillin focal adhesion localization and characterization of a novel motif on paxillin directing vinculin and focal adhesion kinase binding. J. Cell Biol. 135:1109–1123 10.1083/jcb.135.4.1109 - DOI - PMC - PubMed
    1. Bulinski J.C., Odde D.J., Howell B.J., Salmon T.D., Waterman-Storer C.M. 2001. Rapid dynamics of the microtubule binding of ensconsin in vivo. J. Cell Sci. 114:3885–3897 - PubMed

Publication types