. 2010 Apr 6;107(14):6198-203.
doi: 10.1073/pnas.1001945107. Epub 2010 Mar 22.

Transcriptome and metabolome profiling of field-grown transgenic barley lack induced differences but show cultivar-specific variances

Affiliations

Transcriptome and metabolome profiling of field-grown transgenic barley lack induced differences but show cultivar-specific variances

Karl-Heinz Kogel et al. Proc Natl Acad Sci U S A. .

Abstract

The aim of the present study was to assess possible adverse effects of transgene expression in leaves of field-grown barley relative to the influence of genetic background and the effect of plant interaction with arbuscular mycorrhizal fungi. We conducted transcript profiling, metabolome profiling, and metabolic fingerprinting of wild-type accessions and barley transgenics with seed-specific expression of (1,3-1, 4)-beta-glucanase (GluB) in Baronesse (B) as well as of transgenics in Golden Promise (GP) background with ubiquitous expression of codon-optimized Trichoderma harzianum endochitinase (ChGP). We found more than 1,600 differential transcripts between varieties GP and B, with defense genes being strongly overrepresented in B, indicating a divergent response to subclinical pathogen challenge in the field. In contrast, no statistically significant differences between ChGP and GP could be detected based on transcriptome or metabolome analysis, although 22 genes and 4 metabolites were differentially abundant when comparing GluB and B, leading to the distinction of these two genotypes in principle component analysis. The coregulation of most of these genes in GluB and GP, as well as simple sequence repeat-marker analysis, suggests that the distinctive alleles in GluB are inherited from GP. Thus, the effect of the two investigated transgenes on the global transcript profile is substantially lower than the effect of a minor number of alleles that differ as a consequence of crop breeding. Exposing roots to the spores of the mycorrhizal Glomus sp. had little effect on the leaf transcriptome, but central leaf metabolism was consistently altered in all genotypes.


Conflict of interest statement

The authors declare no conflict of interest.

Figures
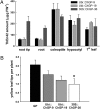
Fig. 1.
Fig. 1.
Characterization of ChGP transformants tissue-specific accumulation of endochitinase ThEn42 in ChGP transformants and its effect on root infections by R. solani AG8. (A) Amounts of endochitinase in tissues of ChGP transformants. Seedlings of the transgenic barley lines Ubi::ChGP-9 (black bars), Ubi::ChGP-19 (light gray bars), and 35S::ChGP-36 (dark gray bars). Endochitinase content in root tips, upper parts of the roots, coleoptiles, hypocotyls, and first leaves (Left to Right) were determined with a fluorometric assay (Fig. S2A and SI Materials and Methods). Data are the mean of five replicate samples ± SEM (B) Reduced disease symptoms on ChGP transformants after root inoculation with R. solani AG8 (SI Materials and Methods). Significant differences to GP with P < 0.05 are indicated by an asterisk above the bars and were calculated with a Welch's modified t test (29).
Fig. 2.
Fig. 2.
Differentially abundant metabolites in barley leaves. Overview of differentially abundant metabolites from the targeted profiling approach with leaf material from 4-month-old, field-grown barley plants representing the treatments (A) cultivar or (B) Amykor. The schematic metabolic diagrams in (A) and (B) represent a map of all analyzed metabolites. The heat map strips next to the metabolite names were taken from the hierarchical cluster analysis (Fig. S4A) conducted with the program Cluster v2.11 (30), with red signals denoting an increased metabolite content relative to average and green signals indicating decreased metabolite contents relative to average. The consistent sample order in these strips is indicated at the bottom of the figure using the genotype and treatment abbreviations used throughout the text and as explained below. The entire dataset, including the results of the significance tests, are given in Table S1. Please note that the color pattern has no implications on statistically significant differences in pairwise comparisons, which were calculated with a Welch-Satterthwaite test embedded in the VANTED software v1.7 (31) and are displayed in Table S1. GP, Golden Promise; B, Baronesse; ChGP, Chitinase GP; GluB, Glucanase B; M, Amykor treatment.
Fig. 3.
Fig. 3.
Principal component analysis (PCA) of multiparallel datasets obtained from field-grown barley leaves. (A) PCA based on 72 metabolites that were analyzed in a targeted fashion (complete dataset displayed in Table S1): For PCA, mean values of four replicate samples per genotype and treatment were taken and the resulting data points labeled as described below. (Left) PCA plot of principal component 1 (PC1) versus principal component 2 (PC2). Circles are drawn around spots derived from the genotype of identical cultivar or treatment and are labeled by letters as indicated below. (Right) loadings plot for PC1 and PC2. The 72 metabolites are individually labeled. (B) PCA of metabolite fingerprinting data. The analysis was computed for the 307 most significant mass signals obtained by metabolite fingerprinting and is based on mean values from four replicate samples (see Materials and Methods). Compounds are labeled according to the quantified transition. Data arrangement and labeling are as described in A. (C) PCA of transcriptome data. PCA was performed based on data from two replicate hybridizations per genotype and treatment. RNA was extracted from aliquots of pooled sample material also used for metabolome analysis. From the 1,660 genes differentially expressed between cultivars B and GP (Table S3), five of the most significant ones were confirmed by qRT-PCR analysis of independent sample aliquots (Fig. S2B). GP, Golden Promise; B, Baronesse; ChGP, Chitinase GP; GluB, Glucanase B; M, Amykor treatment.
Fig. 4.
Fig. 4.
Inheritance of GP alleles in GluB on the lower arm of barley chromosome 7H. Two of the 16 unigenes differentially expressed in both the B vs. GP and the B vs. GluB comparisons could be mapped to the current physical barley map (www.harvest-web.org) and were located at 142 cM and 167 cM on chromosome 7H, respectively. Analysis of the two polymorphic SSR markers EBmag0757 (142 cM) and Bmac0156 (156 cM) revealed retention of the respective GP alleles in GluB that had been generated by introgressing the GluB transgene from GP into B. Locations of the employed markers and the two unigenes of interest on the genetic map are given on the left, their names and annotations are to the right to the chromosomal sketch.

Similar articles

Cited by

References

    1. Cellini F, et al. Unintended effects and their detection in genetically modified crops. Food Chem Toxicol. 2004;42:1089–1125. - PubMed
    1. Schäfer P, et al. Manipulation of plant innate immunity and gibberellin as factor of compatibility in the mutualistic association of barley roots with Piriformospora indica . Plant J. 2009;59:461–474. - PubMed
    1. Fiehn O. Combining genomics, metabolome analysis, and biochemical modeling to understand metabolic networks. Comp Funct Genomics. 2001;2:155–168. - PMC - PubMed
    1. Trethewey RN. Metabolite profiling as an aid to metabolic engineering in plants. Curr Opin Plant Biol. 2004;7:196–201. - PubMed
    1. Gregersen PL, Brinch-Pedersen H, Holm PB. A microarray-based comparative analysis of gene expression profiles during grain development in transgenic and wild type wheat. Transgenic Res. 2005;14:887–905. - PubMed

Publication types

MeSH terms

Substances

Associated data