. 2010 Apr 6;107(14):6526-31.
doi: 10.1073/pnas.0913154107. Epub 2010 Mar 22.

Imaging extrasynaptic glutamate dynamics in the brain

Affiliations

Imaging extrasynaptic glutamate dynamics in the brain

Yohei Okubo et al. Proc Natl Acad Sci U S A. .

Abstract

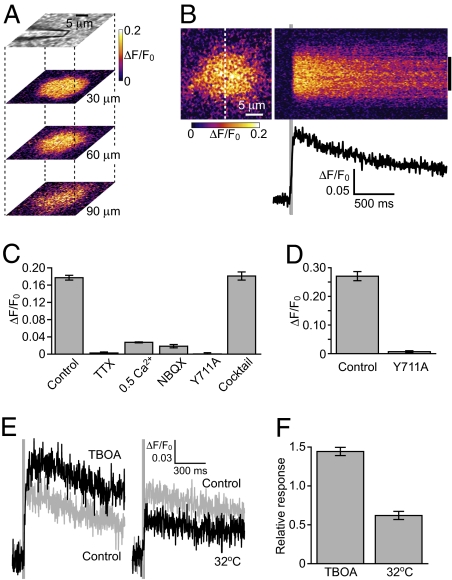
Glutamate is the major neurotransmitter in the brain, mediating point-to-point transmission across the synaptic cleft in excitatory synapses. Using a glutamate imaging method with fluorescent indicators, we show that synaptic activity generates extrasynaptic glutamate dynamics in the vicinity of active synapses. These glutamate dynamics had magnitudes and durations sufficient to activate extrasynaptic glutamate receptors in brain slices. We also observed crosstalk between synapses--i.e., summation of glutamate released from neighboring synapses. Furthermore, we successfully observed that sensory input from the extremities induced extrasynaptic glutamate dynamics within the appropriate sensory area of the cerebral cortex in vivo. Thus, the present study clarifies the spatiotemporal features of extrasynaptic glutamate dynamics, and opens up an avenue to directly visualizing synaptic activity in live animals.


Conflict of interest statement

The authors declare no conflict of interest.

Figures

Fig. 1.
Fig. 1.
Glutamate sensitivity of EOS and extracellular distribution of labeled EOS. (A) Schematic primary structures of K716A-EOS, Y711A-EOS, and L401C-EOS. Replaced amino acids and labeled fluorescent dyes are indicated. The amino acid positions denote those in the original GluR2. (B) Steady-state dose–response relationship between the glutamate concentration and fractional change in the fluorescence intensity (ΔF/F0) of EOS sister indicators measured in vitro using a spectrofluorometer. Estimated Kd of K716A-EOS and L401C-EOS were 174 nM and 1.57 μM, respectively. (C) K716A-EOS labeling in the molecular layer of cerebellar slices. Magnified images show a roughly even distribution of K716A-EOS in the extracellular space. (D and E) Analysis of ultrastructural distribution of K716A-EOS by pre-embedding (D) and post-embedding (E) immunoelectron microscopy. Gold particles were predominantly observed in extrasynaptic and perisynaptic regions. Cyan indicates presynaptic terminal, and magenta indicates postsynaptic spine. Gold particles were observed within the clefts in only four synapses among 189 synapses analyzed in pre-embedding immunoelectron microscopy. Only 28 gold particles among 1,178 particles analyzed were observed within the clefts in post-embedding immunoelectron microscopy.
Fig. 2.
Fig. 2.
Imaging of extrasynaptic glutamate dynamics during synaptic activity. (A) Imaging of K716A-EOS fluorescence at the indicated depths in response to PF stimulation (five pulses at 100 Hz, average of five successive trials). ΔF/F0 was color-coded as indicated. (B) Line-scan imaging across the center of a K716A-EOS signal. Plot of the mean ΔF/F0 within the region indicated by the right-hand side bar is shown. (C) K716A-EOS signals induced by PF stimulation (five pulses at 100 Hz) were blocked with 1 μM TTX, 0.5 mM Ca2+, and 10 μM NBQX, whereas a mixture of glutamate receptor antagonists [50 μM GYKI-52466, 50 μM D-AP5, and 500 μM (RS)-MCPG] had no effect. Y711A-EOS showed no response to PF inputs. Mean ± SEM, n = 6. (D) Perfusion of 1 mM glutamate induced an increase in the fluorescence intensity of K716A-EOS but not that of Y711A-EOS (mean ± SEM, n = 6). (E and F) Contribution of glutamate transporters to extrasynaptic glutamate dynamics. (E) K716A-EOS signal in response to PF stimulation (three pulses at 100 Hz) was enhanced in the presence of 200 μM TBOA and reduced at a higher temperature (32 °C). Average of five successive trials each. (F) Amplitude of K716A-EOS signals in both conditions normalized by that in control condition (mean ± SEM, n = 6).
Fig. 3.
Fig. 3.
Microdomain of extrasynaptic glutamate dynamics. (A) Simultaneous measurement of PF-induced EOS signal and EPSC. (A Left) Purkinje cell within K716A-EOS-labeled region (green) filled with Alexa Fluor 594 (red) via the whole-cell patch pipette. (Middle) Magnified image of the region indicated by the white box. (A Right) Line-scan image of K716A-EOS signal across the dotted white line and corresponding EPSC induced by PF stimulation (five pulses at 100 Hz). (B) The simultaneous measurement of K716A-EOS signals and EPSCs upon the stimulation of a small number of PFs (five pulses at 100 Hz, average of ten successive trials each). (C) Relationship between the amplitude of the K716A-EOS signal and the time-integral of the corresponding EPSC. Data were rank-ordered with the value of the EPSC time-integral, and four to six results were averaged and plotted (mean ± SEM). (D) Spatial distribution of the amplitude of the K716A-EOS signal (gray) was fitted with a Gaussian function (black line). K716A-EOS signals with >0.03 of ΔF/F0 amplitude were analyzed. FWHM values of the Gaussian function were plotted (open circles, n = 6 and filled circle, mean ± SEM).
Fig. 4.
Fig. 4.
Magnitude of extrasynaptic glutamate dynamics. (A) Time course of ΔF/F0 of L401C-EOS induced by one to five pulses of PF stimulation (100 Hz, average of five successive trials). (B) Peak amplitude of the L401C-EOS signal in response to one to five pulses of PF stimulation and to perfusion of 1 mM glutamate (mean ± SEM, n = 6). (C) Estimation of extrasynaptic glutamate concentration. Upper traces show time courses of L401C-EOS signal (average of five successive trials each, n = 6 slices); lower traces show the corresponding time courses of glutamate concentration estimated by the deconvolution method (see text). Magenta traces indicate averaged data. (D) Average of estimated glutamate concentration within 50-ms time window starting from the first PF stimulation (mean ± SEM, n = 6).
Fig. 5.
Fig. 5.
Extrasynaptic glutamate dynamics in neocortical and hippocampal slices. (A and C Left) L401C-EOS labeling in layer 2/3 of a neocortical slice (A) or in the stratum radiatum in CA1 in a hippocampal slice (C). (A and C Right) Magnified image of the region indicated by the white box. (B and D Left) Peak L401C-EOS signal induced by focal stimulation (five pulses at 100 Hz) applied via a stimulating electrode (indicated by white lines). (B and D Right) Line-scan imaging of L401C-EOS signal across the white dotted line in the left image. (E) Extrasynaptic glutamate dynamics upon focal stimulation (two pulses at 100 Hz) in the neocortical and hippocampal slices estimated as in Fig. 4C (average of five successive trials each, n = 6 slices). Magenta traces indicate averaged data. (F) Average of estimated glutamate concentration within 50-ms time window starting from the first stimulation (mean ± SEM, n = 6).
Fig. 6.
Fig. 6.
Extrasynaptic glutamate dynamics upon sensory input from the hind paw. (A) Schema of glutamate imaging in the somatosensory cortex. (B) Flavoprotein fluorescence in the sensory cortex corresponding to the hind paw. (C) L401C-EOS labeling in the same area of the cortex as in (B). (D) Two-dimensional peak L401C-EOS signal induced by 200-ms tactile stimulation to the hind paw. (E and F) Time courses of ΔF/F0 of L401C-EOS or Y711A-EOS in the presence or absence of hind-paw stimulation (gray bar). Traces shown are the results of 12 successive trials in each condition, and magenta traces indicate averaged data. (G) Peak amplitude of the L401C-EOS signal upon hind-paw stimulation (mean ± SEM, n = 4 animals each). **, P < 0.01. (H) Basal fluctuation (coefficient of variation) of fluorescence intensity of L401C-EOS and Y711A-EOS (mean ± SEM, n = 4 animals each). **, P < 0.01.

References

    1. Kullmann DM, Erdemli G, Asztély F. LTP of AMPA and NMDA receptor-mediated signals: evidence for presynaptic expression and extrasynaptic glutamate spill-over. Neuron. 1996;17:461–474. - PubMed
    1. Barbour B, Häusser M. Intersynaptic diffusion of neurotransmitter. Trends Neurosci. 1997;20:377–384. - PubMed
    1. Rusakov DA, Kullmann DM. Extrasynaptic glutamate diffusion in the hippocampus: ultrastructural constraints, uptake, and receptor activation. J Neurosci. 1998;18:3158–3170. - PMC - PubMed
    1. Barbour B. An evaluation of synapse independence. J Neurosci. 2001;21:7969–7984. - PMC - PubMed
    1. Scanziani M, Salin PA, Vogt KE, Malenka RC, Nicoll RA. Use-dependent increases in glutamate concentration activate presynaptic metabotropic glutamate receptors. Nature. 1997;385:630–634. - PubMed

Publication types

LinkOut - more resources