

One-microsecond molecular dynamics simulation of channel gating in a nicotinic receptor homologue
- PMID: 20308576
- PMCID: PMC2852019
- DOI: 10.1073/pnas.1001832107
One-microsecond molecular dynamics simulation of channel gating in a nicotinic receptor homologue
Abstract
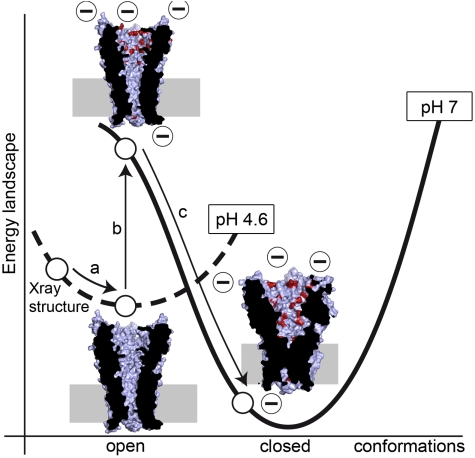
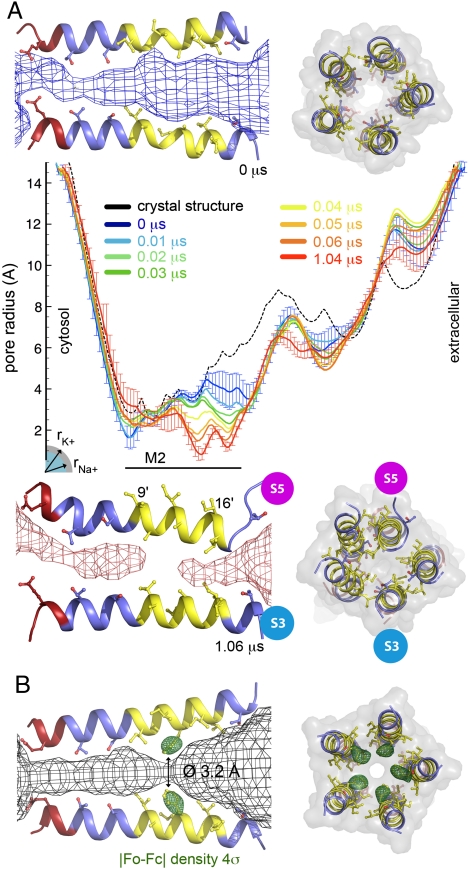
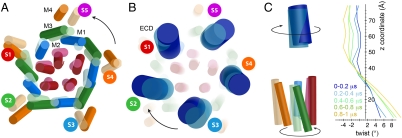
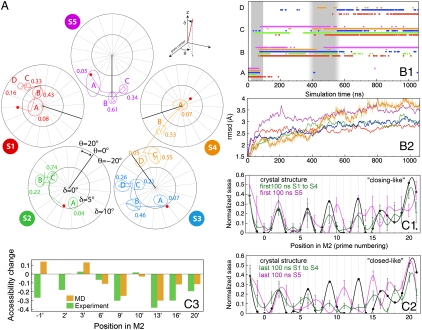
Recently discovered bacterial homologues of eukaryotic pentameric ligand-gated ion channels, such as the Gloeobacter violaceus receptor (GLIC), are increasingly used as structural and functional models of signal transduction in the nervous system. Here we present a one-microsecond-long molecular dynamics simulation of the GLIC channel pH stimulated gating mechanism. The crystal structure of GLIC obtained at acidic pH in an open-channel form is equilibrated in a membrane environment and then instantly set to neutral pH. The simulation shows a channel closure that rapidly takes place at the level of the hydrophobic furrow and a progressively increasing quaternary twist. Two major events are captured during the simulation. They are initiated by local but large fluctuations in the pore, taking place at the top of the M2 helix, followed by a global tertiary relaxation. The two-step transition of the first subunit starts within the first 50 ns of the simulation and is followed at 450 ns by its immediate neighbor in the pentamer, which proceeds with a similar scenario. This observation suggests a possible two-step domino-like tertiary mechanism that takes place between adjacent subunits. In addition, the dynamical properties of GLIC described here offer an interpretation of the paradoxical properties of a permeable A13'F mutant whose crystal structure determined at 3.15 A shows a pore too narrow to conduct ions.
Conflict of interest statement
The authors declare no conflict of interest.
Figures
Similar articles
-
Ion selectivity mechanism in a bacterial pentameric ligand-gated ion channel.Biophys J. 2011 Jan 19;100(2):390-8. doi: 10.1016/j.bpj.2010.11.077. Biophys J. 2011. PMID: 21244835 Free PMC article.
-
Pore opening and closing of a pentameric ligand-gated ion channel.Proc Natl Acad Sci U S A. 2010 Nov 16;107(46):19814-9. doi: 10.1073/pnas.1009313107. Epub 2010 Nov 1. Proc Natl Acad Sci U S A. 2010. PMID: 21041674 Free PMC article.
-
Structure of a potentially open state of a proton-activated pentameric ligand-gated ion channel.Nature. 2009 Jan 1;457(7225):115-8. doi: 10.1038/nature07461. Epub 2008 Nov 5. Nature. 2009. PMID: 18987630
-
Atomic structure and dynamics of pentameric ligand-gated ion channels: new insight from bacterial homologues.J Physiol. 2010 Feb 15;588(Pt 4):565-72. doi: 10.1113/jphysiol.2009.183160. Epub 2009 Dec 7. J Physiol. 2010. PMID: 19995852 Free PMC article. Review.
-
A gating mechanism of pentameric ligand-gated ion channels.Proc Natl Acad Sci U S A. 2013 Oct 15;110(42):E3987-96. doi: 10.1073/pnas.1313785110. Epub 2013 Sep 16. Proc Natl Acad Sci U S A. 2013. PMID: 24043807 Free PMC article. Review.
Cited by
-
Lipid molecules can induce an opening of membrane-facing tunnels in cytochrome P450 1A2.Phys Chem Chem Phys. 2016 Nov 9;18(44):30344-30356. doi: 10.1039/c6cp03692a. Phys Chem Chem Phys. 2016. PMID: 27722524 Free PMC article.
-
Large-Scale Conformational Changes and Protein Function: Breaking the in silico Barrier.Front Mol Biosci. 2019 Nov 5;6:117. doi: 10.3389/fmolb.2019.00117. eCollection 2019. Front Mol Biosci. 2019. PMID: 31750315 Free PMC article. Review.
-
Illumination of a progressive allosteric mechanism mediating the glycine receptor activation.Nat Commun. 2023 Feb 13;14(1):795. doi: 10.1038/s41467-023-36471-7. Nat Commun. 2023. PMID: 36781912 Free PMC article.
-
Crystal structures of a cysteine-modified mutant in loop D of acetylcholine-binding protein.J Biol Chem. 2011 Feb 11;286(6):4420-8. doi: 10.1074/jbc.M110.188730. Epub 2010 Nov 29. J Biol Chem. 2011. PMID: 21115477 Free PMC article.
-
Allosteric regulation of pentameric ligand-gated ion channels: an emerging mechanistic perspective.Channels (Austin). 2014;8(4):350-60. doi: 10.4161/chan.29444. Channels (Austin). 2014. PMID: 25478624 Free PMC article. Review.
References
-
- Lester RA. Activation and desensitization of heteromeric neuronal nicotinic receptors: implications for non-synaptic transmission. Bioorg Med Chem Lett. 2004;14(8):1897–1900. - PubMed
-
- Sine SM, Engel AG. Recent advances in Cys-loop receptor structure and function. Nature. 2006;440(7083):448–455. - PubMed
-
- Enna SJ, Moehler H. The GABA Receptors. Totowa, NJ: Humana Press; 2007.
-
- Lee WY, Sine SM. Principal pathway coupling agonist binding to channel gating in nicotinic receptors. Nature. 2005;438(7065):243–247. - PubMed
Publication types
MeSH terms
Substances
Associated data
- Actions
LinkOut - more resources
Full Text Sources
Other Literature Sources
Molecular Biology Databases
Miscellaneous
