. 2010 Apr 6;107(14):6316-21.
doi: 10.1073/pnas.0914218107. Epub 2010 Mar 22.

Mapping amorphous calcium phosphate transformation into crystalline mineral from the cell to the bone in zebrafish fin rays

Affiliations

Mapping amorphous calcium phosphate transformation into crystalline mineral from the cell to the bone in zebrafish fin rays

Julia Mahamid et al. Proc Natl Acad Sci U S A. .

Abstract

The continuously forming fin bony rays of zebrafish represent a simple bone model system in which mineralization is temporally and spatially resolved. The mineralized collagen fibrils of the fin bones are identical in structure to those found in all known bone materials. We study the continuous mineralization process within the tissue by using synchrotron microbeam x-ray diffraction and small-angle scattering, combined with cryo-scanning electron microscopy. The former provides information on the mineral phase and the mineral particles size and shape, whereas the latter allows high-resolution imaging of native hydrated tissues. The integration of the two techniques demonstrates that new mineral is delivered and deposited as packages of amorphous calcium phosphate nanospheres, which transform into platelets of crystalline apatite within the collagen matrix.


Conflict of interest statement

The authors declare no conflict of interest.

Figures

Fig. 1.
Fig. 1.
(A) Representative polarized light micrograph showing two bony rays, bifurcating distally, photographed within the caudal fin tissue of a TL zebrafish. (B) A fin bony ray segment reconstructed from x-ray microcomputed tomography, showing the geometry of the measurements performed. Each ray is composed of many segments (one segment is shown between the two white arrowheads in A and B, ∼300 μm long) and each segment is composed of two hemirays (B) held together by soft tissue. Continuous ray growth occurs by addition of new segments to the distal end (top in A, z direction in B) and thickening of each segment (x and y directions in B). In B, white arrows indicate the x-ray beam (diameter 10 μm) direction in the microbeam measurements. Two planes are marked in red and blue that represent two orientations in which the samples were observed in cryo-SEM (red: transverse sections; blue: longitudinal fracture surfaces). (C) Cryo-SEM micrographs of longitudinal fracture surfaces (blue plane in B) through native, high pressure frozen mature bone (Bottom) and younger bone (Top), represented on the same scale. The difference in bone thickness reflects the continuous thickening of the segments. Growth zones at the bone edges are indicated.
Fig. 2.
Fig. 2.
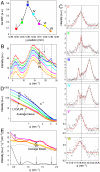
Calcium XRF, WAXD, and SAXS simultaneously acquired with a 10-μm beam on representative TL zebrafish caudal fin bony rays within the tissue. (A) Light micrograph of caudal fin—delineated area (200 μm long) represents bony ray segments investigated in BD. (BD) Maps at 10-μm resolution of Ca XRF, WAXD, and SAXS, respectively. (B) Gray level indicates calcium levels (white: highest counts). Colored rectangles indicate positions across the bone for which Ca XRF, WAXD, and SAXS analysis are detailed in Fig. 3. (C) Mineral phases: white—bone apatite diffraction; light gray—mineral phase producing amorphous scatter; dark gray—organic tissue scattering; black—no signal. The mineral phase assignment is derived from the spectra in Fig. 3. (D) Particle morphologies: white—typical bone platelet scattering; light gray—spherical particles producing oscillatory scatter; dark gray—organic tissue scattering; black—no signal. The particle morphologies are derived from the spectra in Fig. 3.
Fig. 3.
Fig. 3.
Calcium XRF (A), WAXD (B and C), and SAXS (D and E) profiles of a representative line scan transverse to the fin bone long axis, indicated by rectangles in Fig. 2B. (A) Calcium levels highlight the bone profile: Highest reading (blue, III)—center of the bone; red (I), magenta (V), and yellow (VI)—bone edges/growth zones; orange (VII)—organic tissue outside the bone. The same color code and numbering are used to indicate measurement position across the bone throughout the figure. (B) The WAXD patterns are dominated by two very broad peaks originating from the organic tissue. Curves were normalized to the curve representing the tissue scattering at q = 9–14 nm-1, and the intensity was shifted arbitrarily for simplified visualization; dashed black lines—carbonated hydroxyapatite reflections in the green-cyan (II–IV) curves; arrow—broad peak in the red and magenta (I, V) curves. (C) Data plotted in B (I–VI) after tissue background subtraction and peak fitting; gray lines—individual fitted peaks; red lines—overall fit. In III and IV, crystalline carbonated hydroxyapatite diffraction peaks appear at 18.4 nm-1 (002), 20.5 nm-1 [unresolved (102) and (210) reflections], and 22.5 nm-1 [unresolved (211), (112), and (300) reflections]. In I, V, and VI, a disordered phase appears at 19.4 nm-1 (Dashed Line), which becomes crystalline (Sharp Peak) in II and IV. (D) SAXS profiles plotted on a double-logarithmic scale. Green-cyan (II–IV) produce typical bone SAXS following Porod’s approximation (slope q-4). Measurements from bone edges and within the organic tissue produce different, low intensity scatter, better resolved in E. The dashed gray line is an average of 4 measurements from organic tissue at different locations, arbitrarily shifted in intensity. (E) Data multiplied by q2 and plotted on a linear scale (Kratky plot). Red (I) and magenta (V) show two distinct minima (0.75 and 1.29 nm-1) that coincide with minima produced in the calculated SAXS for monodisperse spheres of radius 6 nm (Black Curve, Arrows). Organic tissue gives a maximum at 0.7 nm-1; the yellow (VI) curve has much scattering contribution from the organic tissue.
Fig. 4.
Fig. 4.
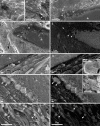
(A and B) High-resolution cryo-SEM images of newly mineralized and mature-mineralized bone. (A) Distal, newly mineralized bone showing spherical mineral particles (Arrowheads). (B) Mature bone showing mineral particles in the shape of thin platelets (Arrowheads). (CK) Cryo-SEM micrographs of the bone growth zone in high pressure frozen caudal fin tissue. (C, D, F, H, and J) Secondary electrons images. (E, G, I, and K) Backscattered electrons images of D, F, H, and J; asterisks—bone; M—nonmineralized matrix; white arrowheads—large globular mineralized entities. (CE) Tissue cryosectioned transverse to the fin ray long axis (Fig. 1B: red plane). (FK) Tissue freeze fractured parallel to the fin ray long axis (Fig. 1B: blue plane). (Inset in G) Higher magnification of delineated intracellular vesicle from F, which gives a backscattered electron signal in G. The mineral packet is nanostructured. (H and I) The newly deposited, nonmineralized bone matrix (M) contains large, mineral-bearing globular entities. The globules fuse into the mineralizing bone matrix. (Inset in I) Higher magnification of delineated area from H, showing the nanosphere subparticles composing the large mineral globules. (J and K) Mineral-bearing globules infusing the collagen fibrils within the growth zone. Black arrowheads—collagen banding.

Similar articles

Cited by

References

    1. Weiner S. Transient precursor strategy in mineral formation of bone. Bone. 2006;39:431–433. - PubMed
    1. Grynpas MD, Omelon S. Transient precursor strategy or very small biological apatite crystals? Bone. 2007;41:162–164. - PubMed
    1. Olszta MJ, et al. Bone structure and formation: A new perspective. Mat Sci Eng R. 2007;58:77–116.
    1. Christoffersen J, Christoffersen MR, Kibalczyc W, Andersen FA. A contribution to the understanding of the formation of calcium phosphates. J Cryst Growth. 1989;94:767–777.
    1. Crane NJ, et al. Raman spectroscopic evidence for octacalcium phosphate and other transient mineral species deposited during intramembranous mineralization. Bone. 2006;39:434–442. - PubMed

Publication types

Substances

LinkOut - more resources