. 2010 Apr 6;107(14):6286-91.
doi: 10.1073/pnas.0913357107. Epub 2010 Mar 22.

Revealing strengths and weaknesses of methods for gene network inference

Affiliations

Revealing strengths and weaknesses of methods for gene network inference

Daniel Marbach et al. Proc Natl Acad Sci U S A. .

Abstract

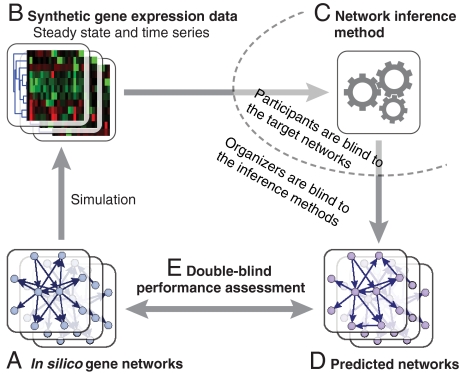
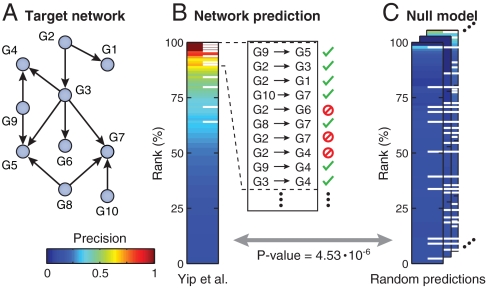
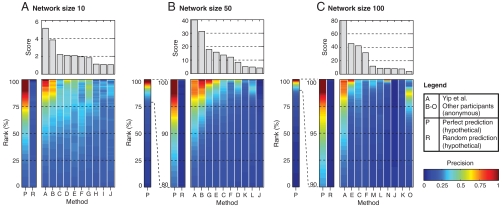
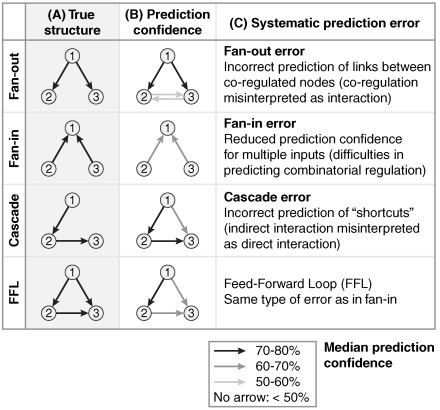
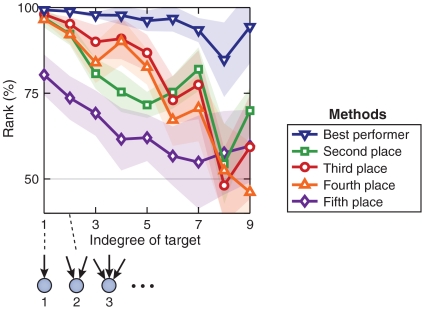
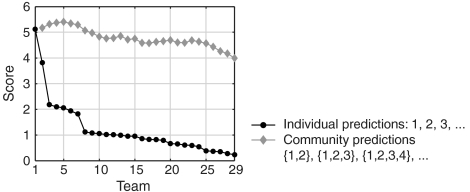
Numerous methods have been developed for inferring gene regulatory networks from expression data, however, both their absolute and comparative performance remain poorly understood. In this paper, we introduce a framework for critical performance assessment of methods for gene network inference. We present an in silico benchmark suite that we provided as a blinded, community-wide challenge within the context of the DREAM (Dialogue on Reverse Engineering Assessment and Methods) project. We assess the performance of 29 gene-network-inference methods, which have been applied independently by participating teams. Performance profiling reveals that current inference methods are affected, to various degrees, by different types of systematic prediction errors. In particular, all but the best-performing method failed to accurately infer multiple regulatory inputs (combinatorial regulation) of genes. The results of this community-wide experiment show that reliable network inference from gene expression data remains an unsolved problem, and they indicate potential ways of network reconstruction improvements.


Conflict of interest statement

The authors declare no conflict of interest.

Figures

Fig. 1.
Fig. 1.
Double-blind performance assessment of network-inference methods. (A, B) From a set of in silico benchmark networks (the so-called gold standards), steady-state and time-series gene expression data was generated and provided as a community-wide reverse engineering challenge. (C, D) Participating teams were asked to predict the structure of the benchmark networks from this data. They were blind to the true structure of these networks. (E) We evaluated the submitted predictions, being blind to the inference methods that produced them. This allowed for a double-blind performance assessment.
Fig. 2.
Fig. 2.
Evaluation of network predictions. (A) The true connectivity of one of the benchmark networks of size 10. (B) Example of a submitted prediction (it is the prediction of Yip et al., the best-performer team). The format is a ranked list of predicted edges, represented here by the vertical colored bar. The white stripes indicate the true edges of the target network. A perfect prediction would have all white stripes at the top of the list. The inset shows the first ten predicted edges: the top four are correct, followed by an incorrect prediction, etc. The color indicates the precision at that point in the list. E.g., after the first ten predictions, the precision is 0.7 (7 correct predictions out of 10 predictions). (C) The network prediction is evaluated by computing a P-value that indicates its statistical significance compared to random network predictions.
Fig. 3.
Fig. 3.
Average performance of the best ten teams for each of the three subchallenges. The bar plots on top show the overall scores, and the color bars below show the precision of the corresponding lists of predictions, as explained in Fig. 2 (since each subchallenge has five networks, this is the average precision of the five lists). In addition to the submitted network predictions (methods A–O), we always show the plots for a hypothetical perfect prediction P (all true edges at the top of the list) and a randomly generated prediction R, which allows to visually appreciate the quality of the submitted predictions. Remember that for networks of size 10, 50, and 100, the length of the lists is 90, 2,450, and 9,900 edges. Note that for networks of size 50 and size 100, we have zoomed in to the top 20% and 10% of the lists, respectively.
Fig. 4.
Fig. 4.
Systematic errors in the prediction of motifs. (A) The true connectivity of the motifs. (B) As an example, we show how the motifs were predicted on average by the inference method that ranked second on the networks of size 100 (8). The darkness of the links indicates their median prediction confidence. (C) We can identify three types of systematic prediction errors: the fan-out error, the fan-in error, and the cascade error.
Fig. 5.
Fig. 5.
How the indegree of genes affects the prediction confidence. The plots show, for the best five methods on networks of size 100, the median prediction confidence for links that target genes of increasing indegree. The shaded areas indicate 95% confidence intervals for the medians. Single-input links were reliably predicted with a similar, high prediction confidence by the best four methods (points in the top left corner). However, for all but the best-performer method, the performance drops drastically for higher indegrees.
Fig. 6.
Fig. 6.
Performance of community predictions for the networks of size 10. The circles are the scores of the individual teams. The diamonds correspond to the scores of the different community predictions, obtained by combining the two best teams, the three best teams, the four best teams, etc.

References

    1. Levine AJ, Oren M. The first 30 years of p53: growing ever more complex. Nat Rev Cancer. 2009;9:749–758. - PMC - PubMed
    1. De la Fuente A, Brazhnik P, Mendes P. Linking the genes: Inferring quantitative gene networks from microarray data. Trends Genet. 2002;18:395–98. - PubMed
    1. Gardner TS, di Bernardo D, Lorenz D, Collins JJ. Inferring genetic networks and identifying compound mode of action via expression profiling. Science. 2003;301:102–105. - PubMed
    1. Friedman N. Inferring cellular networks using probabilistic graphical models. Science. 2004;303:799–805. - PubMed
    1. Di Bernardo D, et al. Chemogenomic profiling on a genome-wide scale using reverse-engineered gene networks. Nat Biotechnol. 2005;23:377–83. - PubMed

Publication types

LinkOut - more resources