. 2010 Jul;62(7):1881-9.
doi: 10.1002/art.27464.

Near-infrared lymphatic imaging demonstrates the dynamics of lymph flow and lymphangiogenesis during the acute versus chronic phases of arthritis in mice

Affiliations

Near-infrared lymphatic imaging demonstrates the dynamics of lymph flow and lymphangiogenesis during the acute versus chronic phases of arthritis in mice

Quan Zhou et al. Arthritis Rheum. 2010 Jul.

Abstract

Objective: To develop an in vivo imaging method to assess lymphatic draining function in the K/BxN mouse model of inflammatory arthritis.

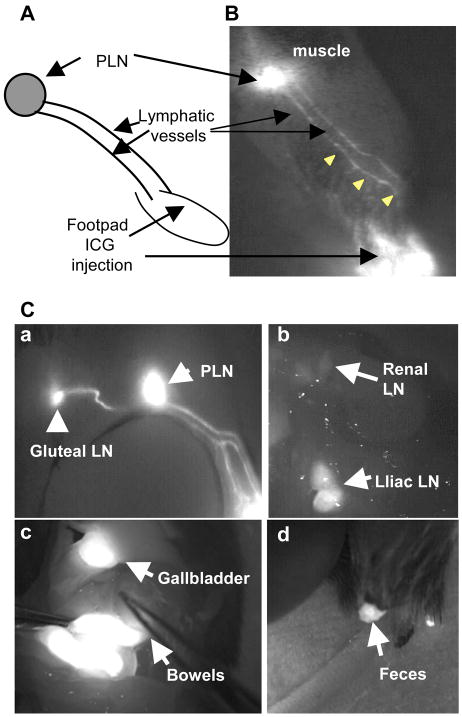
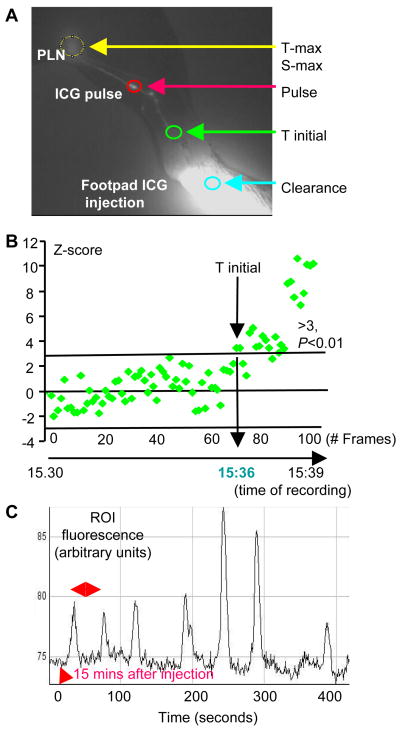
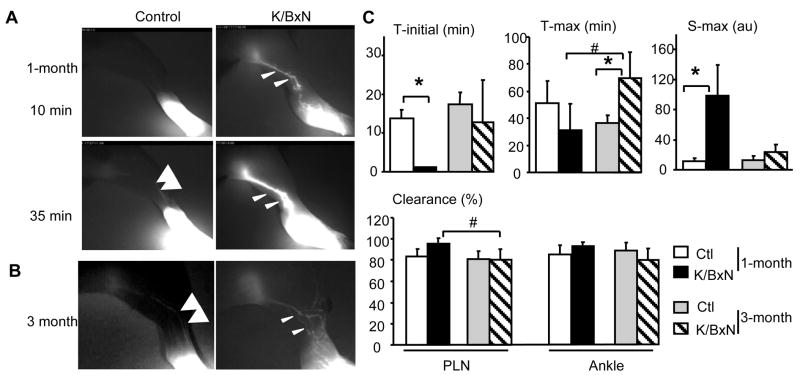
Methods: Indocyanine green, a near-infrared fluorescent dye, was injected intradermally into the footpads of wild-type mice, mouse limbs were illuminated with an 806-nm near-infrared laser, and the movement of indocyanine green from the injection site to the draining popliteal lymph node (LN) was recorded with a CCD camera. Indocyanine green near-infrared images were analyzed to obtain 5 measures of lymphatic function across time. Images of K/BxN arthritic mice and control nonarthritic littermates were obtained at 1 month of age, when acute joint inflammation commenced, and again at 3 months of age, when joint inflammation became chronic. Lymphangiogenesis in popliteal LNs was assessed by immunochemistry.

Results: Indocyanine green and its transport within lymphatic vessels were readily visualized, and quantitative measures were derived. During the acute phase of arthritis, the lymphatic vessels were dilated, with increased indocyanine green signal intensity and lymphatic pulses, and popliteal LNs became fluorescent quickly. During the chronic phase, new lymphatic vessels were present near the foot. However, the appearance of indocyanine green in lymphatic vessels was delayed. The size and area of popliteal LN lymphatic sinuses progressively increased in the K/BxN mice.

Conclusion: Our findings indicate that indocyanine green near-infrared lymphatic imaging is a valuable method for assessing the lymphatic draining function in mice with inflammatory arthritis. Indocyanine green-near-infrared imaging of K/BxN mice identified 2 distinct lymphatic phenotypes during the acute and chronic phase of inflammation. This technique can be used to assess new therapies for lymphatic disorders.


Figures

Figure 1
Figure 1. Lymphatic flow in the mouse leg
Adult C57/B6 wild type mice were used. (A) A photo taken 5 min after intradermal injection of blue ink into the footpad shows the path of ink flow from the injection site to the PLN through 2 lymphatic vessels (green arrows). (B) A schematic diagram and (C) an ICG-NIR image illustrate the movement of ICG along the lymphatic vessels from the footpad to the PLN. (D) ICG-NIR images show the ICG clearance from lymphatics (a) to internal organs (b,c), and excreted in feces (d). In this experiment, a double dose of ICG was intradermally injected into the footpad (a), and massage was applied upon the injection site to enhance lymphatic flow. The abdomen was opened and exposed to the NIR laser for observation of the deep lymph nodes and internal organs (b,c).
Figure 2
Figure 2. Quantitative assessment of ICG-NIR images to evaluate lymphatic draining function in the mouse leg
Adult C57/B6 wild type mice were used (n=4), and data from a representative animal are shown. (A) An ICG-NIR image indicates selected regions of interest (ROI) for quantitative analyses. (B) The primary data from a real time NIR imaging video demonstrates the time it takes for ICG to travel from the footpad to the lymphatic vessel (green circle in A) as T initial. (C) The histogram shows a typical ICG pulses from a wild type mouse under anesthesia. For quantification, a ROI for pulse was identified (red circle in A). The number of lymphatic pulses that pass the ROI over 400 seconds was calculated from the NIR real time video to derive the number of lymphatic pulses per min and the pulse interval (double headed arrow).
Figure 3
Figure 3. Lymphatic flow is significantly increased during acute arthritis but not during chronic disease
K/B×N mice and non-arthritic control littermates were subjected to ICG-NIR imaging at 1 and 3 months of age. (A) At 1-month, the ICG-NIR images that were taken at 10 and 35 min after ICG injection at a low camera threshold intensity show very bright and dilated lymphatic vessels (arrow-heads) in a K/B×N mouse with acute arthritis compared to control mice (arrows). (B) At 3-month, the ICG-NIR images that were taken at the maximum camera threshold intensity after ICG injection show numerous lymphatic vessels (arrow-heads) in the K/B×N leg with chronic arthritis compared to the two major lymphatic vessels in the control leg (arrows). (C) The lymphatic draining function was measured from ICG-NIR images as Ti, T-max, S-max and clearance. Values are the mean + SD of 4–8 mice. *p<0.05 vs control mice; # p<0.05 vs 1-month-old K/B×N mice.
Figure 4
Figure 4. Lymphatic pulses are significantly increased during acute arthritis but not during chronic disease
(A) Representative histograms of lymphatic pulses in a 1-month-old K/B×N mouse (upper) compared to its control littermate (lower). Histograms from 3-month-old K/B×N mice with chronic arthritis were similar to control (data not shown). ICG-NIR images from which the histogram was derived show the pulsatile nature of ICG movement through the lymphatic vessels (arrows) in real time as illustrated by the change in signal intensity from the dilated phase to the contracted phase of the pulse. (B) Quantitative analyses of lymphatic pulses and the time interval among pulses. Values are the mean + SD of 4–8 mice. * p<0.05 vs control mice.
Figure 5
Figure 5. Lymphangiogenesis in PLNs of K/B×N mice is continually increase from the acute through the chronic phases of arthritis
(A) Weight of PLNs from 1 and 3 month-old control and K/B×N mice (n=4–8). (B) Representative micrographs of PLN sections from 1-month-old (a–c) and 3-month-old (d–f) WT (a,d) and K/B×N (b,c,e,f) mice. Sections were stained with rabbit anti-LYVE-1 antibody followed by Alexa Fluor 488 goat anti-rabbit IgG to identify lymphatic vessels (green), and PE-anti-CD31 antibody for blood vessels (red). Pictures were taken at ×5 (a,b,d,e) and ×10 (c,f), showing markedly dilated lymphatic sinuses in 3-month-old K/B×N mice (yellow arrows). (C) Histomorphormetric analysis of LYVE-1-stained PLN sections. The percentage of LYVE-1+ lymphatic vessels per PLN (left) and the area within the lymphatic vessels are shown. Values are the mean of + SD of 4 PLNs. *p<0.05 vs control mice; # p<0.05 vs 1-month-old K/B×N mice.

References

    1. Koch AE. Review: angiogenesis: implications for rheumatoid arthritis. Arthritis Rheum. 1998;41:951–962. - PubMed
    1. Firestein GS. Evolving concepts of rheumatoid arthritis. Nature. 2003;423:356–361. - PubMed
    1. Gerli R, Solito R, Weber E, Agliano M. Specific adhesion molecules bind anchoring filaments and endothelial cells in human skin initial lymphatics. Lymphology. 2000;33:148–157. - PubMed
    1. Olszewski WL, Pazdur J, Kubasiewicz E, Zaleska M, Cooke CJ, Miller NE. Lymph draining from foot joints in rheumatoid arthritis provides insight into local cytokine and chemokine production and transport to lymph nodes. Arthritis Rheum. 2001;44:541–549. - PubMed
    1. Cha HS, Bae EK, Koh JH, Chai JY, Jeon CH, Ahn KS, Kim J, Koh EM. Tumor necrosis factor-alpha induces vascular endothelial growth factor-C expression in rheumatoid synoviocytes. J Rheumatol. 2007;34:16–19. - PubMed

Publication types

MeSH terms