

doi: 10.1121/1.3290991.
Interaural coherence for noise bands: waveforms and envelopes
Affiliations
- PMID: 20329836
- PMCID: PMC2906201
- DOI: 10.1121/1.3290991
Item in Clipboard
Interaural coherence for noise bands: waveforms and envelopes
J Acoust Soc Am.
2010 Mar.
Abstract
This paper reports the results of experiments performed in an effort to find a formulaic relationship between the interaural waveform coherence of a band of noise gamma(W) and the interaural envelope coherence of the noise band gamma(E). An interdependence described by gamma(E)=pi/4+(1-pi/4)(gamma(W))(2.1) is found. This relationship holds true both in a computer experiment and for binaural measurements made in two rooms using a KEMAR manikin. Room measurements are used to derive a measure of reliability for the formula. Ultimately, a user who knows the waveform coherence can predict the envelope coherence with a small degree of uncertainty.
Figures
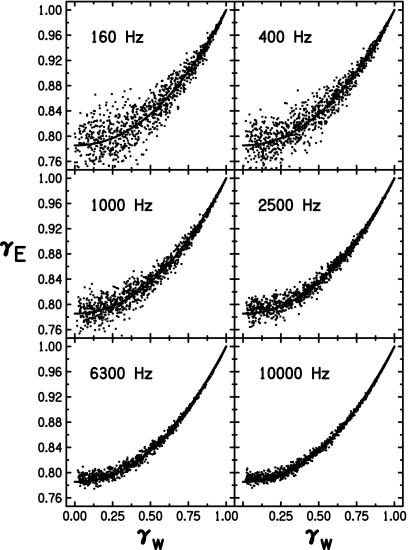
Plots of envelope interaural coherence versus waveform interaural coherence for simulated binaural signals using Gaussian noise pairs in six different 1∕3-octave bands. Each band contains 1001 coherence pairs, each of which is a single data point. A best-fitting line to Eq. 6 is shown as a thick solid line in each plot, though it may be obscured by the data points. The value of the power parameter n, to two significant figures, is 2.1 for each set of points in each panel.
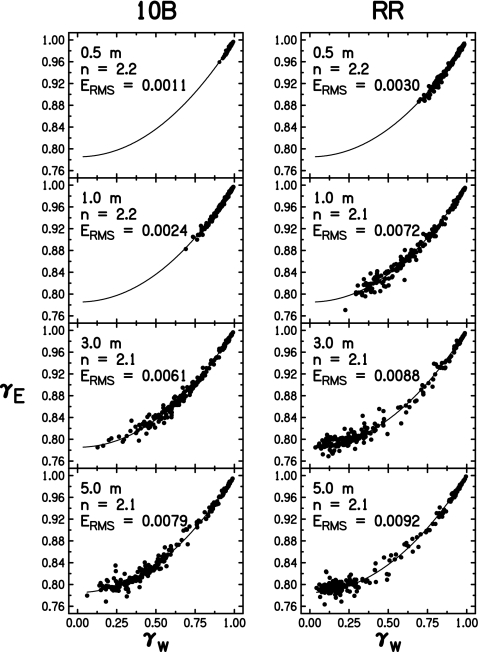
Combined envelope versus waveform-coherence data across all 1∕3-octave bands measured in rooms 10B and the reverberant room at each source distance. Trend lines show the best fit of the data in each panel to Eq. 6. The value of the fitting parameter n is shown in the upper-left corner of each panel. Because of the relative insensitivity of the curve to the exact value of n, only standard deviations greater than ±0.05 are given. The rms error of the data to the best fit Erms is given on the scale of coherence (0–1.0). Therefore, in room 10B at 1.0 m, where the mean γE is 0.96 and the rms error is 0.0024, the rms error is 0.25%.
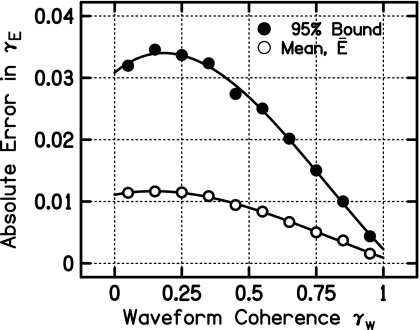
The 95% bound curve (closed circles) gives the absolute error in envelope coherence for which 95% of the simulated coherences deviate by that amount or less from the coherence predicted by Eq. 7. The mean curve (open circles) gives the mean absolute error relative to Eq. 7 for simulated envelope coherences. Both curves are third-order polynomials fitted to the absolute errors of the binned data.
References
-
- Ando, Y. (1998). Architectural Acoustics—Blending Sound Sources, Sound Fields, and Listeners (Springer-Verlag, New York: ).
-
- Beranek, L. L. (1986). Acoustics (American Institute of Physics, New York: ).
Publication types
MeSH terms
Grants and funding
LinkOut - more resources
Full Text Sources
Other Literature Sources
Medical
Research Materials
Miscellaneous