. 2010 Mar;127(3):1673-80.
doi: 10.1121/1.3290988.

Do ferrets perceive relative pitch?

Affiliations

Do ferrets perceive relative pitch?

Pingbo Yin et al. J Acoust Soc Am. 2010 Mar.

Abstract

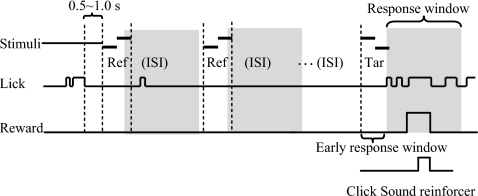
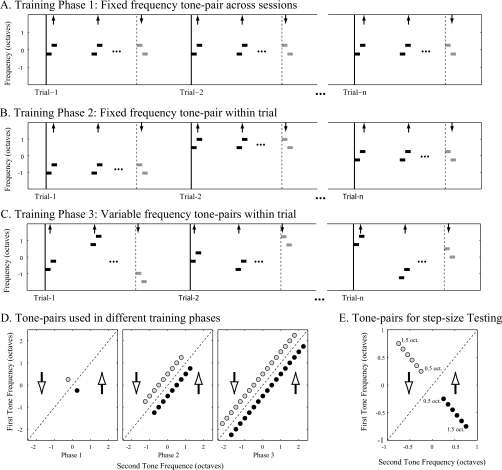
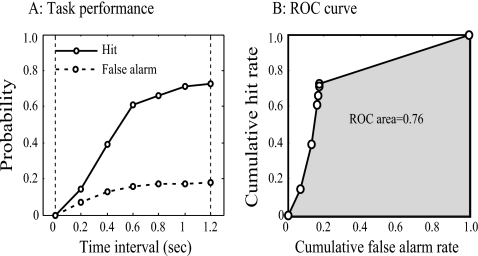
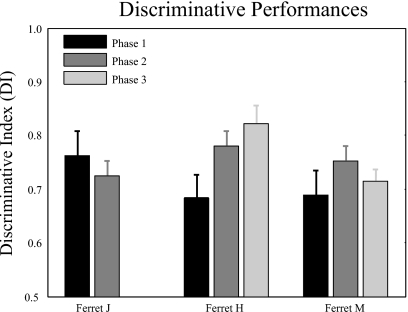
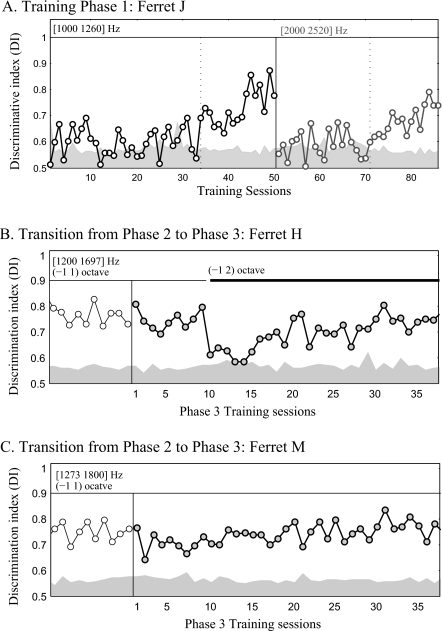
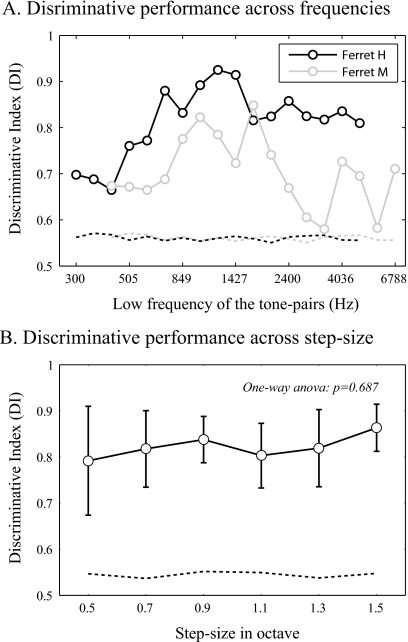
The existence of relative pitch perception in animals is difficult to demonstrate, since unlike humans, animals often attend to absolute rather than relative properties of sound elements. However, the results of the present study show that ferrets can be trained using relative pitch to discriminate two-tone sequences (rising vs. falling). Three ferrets were trained using a positive-reinforcement paradigm in which sequences of reference (one to five repeats) and target stimuli were presented, and animals were rewarded only when responding correctly to the target. The training procedure consisted of three training phases that successively shaped the ferrets to attend to relative pitch. In Phase-1 training, animals learned the basic task with sequences of invariant tone-pairs and could use absolute pitch information. During Phase-2 training, in order to emphasize relative cues, absolute pitch was varied each trial within a two-octave frequency range. In Phase-3 training, absolute pitch cues were removed, and only relative cue information was available to solve the task. Two ferrets successfully completed training on all three phases and achieved significant discriminative performance over the trained four-octave frequency range. These results suggest that ferrets can be trained to discern the relative pitch relationship of a sequence of tone-pairs independent of frequency.


Figures

Figure 1
Figure 1
Positive-reinforcement operant paradigm. A trial was initiated when the animal refrained from licking the waterspout for 0.5–1.0 s. A reference sound (non-target) was presented and repeated randomly one to five times after trial initiation. A target sound followed the reference sounds. When the ferret licked the waterspout within a 1.2 s response time window after target onset (the shaded target period), its response was counted as a hit, which was followed by water reward. If the ferret licked the waterspout within a corresponding time window after reference sound onset (the shaded reference period), its response was counted as a false alarm, which caused reduction in reward volume. A miss of the target lead to a 3–6 s timeout penalty after completion of the trial. A click sound was played as a secondary reward reinforcer after water reward delivery.
Figure 2
Figure 2
Two-tone sequence discrimination task: Training procedures and stimuli sets. (A) Phase-1 training: The reference and target sequences were comprised of one tone-pair with fixed frequency across all training sessions. (B) Phase-2 training: The reference and target sequences for each trial were comprised of one tone-pair with fixed frequency, while the frequency of the tone-pair was changed randomly between successive trials. (C) Phase-3 training: Each of the reference or target sequences in a given trial was comprised of different tone-pairs for which the frequency of the tone-pair was chosen randomly from a set of 17 possible pairs. (D) Tone-pairs in different training phases: The rising and falling two-tone sequences were made from 1 tone-pair in Phase 1 (the left panel), 9 tone-pairs in Phase 2 (the middle panel), and up to 17 tone-pairs in Phase 3 (the right panel). The tone components of the two-tone sequence were 1∕2 octave apart in frequency, and the frequency contours of the sequences were roved up or down with 1∕4 octave increments. (E) Tone-pairs for step-size testing: The stimulus set varied the frequency separation between component tones, ranging from 0.5 up to 1.5 octaves. The solid vertical lines in (A)–(C) indicate the beginning of the trials. The vertical dashed lines indicate the target onset of each trial. The diagonal lines in (D) and (E) denote the iso-frequency line. The up and down arrows indicate directions of the reference and target sequence in (A)–(C) and of the quadrants in (D) and (E).
Figure 3
Figure 3
Construction of ROC curve. (A) The probabilities for hit (solid line) and false alarm (dashed line) were independently computed at each of the time intervals from 0.0 to 1.2 s with 0.2 s increments following the onset of the response window after the target and reference. The vertical dashed lines indicate the start and the end of the response window. (B) The false-alarm probability function was plotted against hit probability function to construct the ROC curve (solid line). The area under the ROC curve (shaded area) was a measure of discriminative performance of the task.
Figure 4
Figure 4
Discriminative performances for all training phases. The bar plots show the average DI values, each of which was computed from ten consecutive sessions of Phase 1 (black), Phase 2 (dark gray), and Phase 3 (light gray) performances after reaching training criterion. The error bar indicates standard deviation.
Figure 5
Figure 5
The frequency transposition in Phase-1 training and the transition from Phase 2 to Phase 3. (A) The figure shows Phase-1 training data for ferret J. Phase-1 training was started (Training session=0) with a tone-pair at frequencies [1000 1260] Hz, and after learning the first pair, training was continued (Training session=50) with the second tone-pair at frequencies [2000 2520] Hz (the vertical solid line). [(B) and (C)] The animals maintained a high performance level when moved from Phase 2 (open circles) into Phase 3 (filled circles) when training within the same frequency range (indicated by the thin horizontal line on the top of each figure). In (B) the starting frequency range varied one octave above and below the initial frequency of the tone-pair [1200, 1697] Hz. Performance deteriorated when the frequency range of possible tone-pairs was extended an additional octave to two octaves above the initial tone-pair [indicated by the thick horizontal line in (B)] and regained after additional Phase-3 training. In (C) there was no change in frequency range during the transition from Phase 2 to Phase 3. The shaded area in (A)–(C) indicate the baseline performance (mean plus two standard deviation of the shuffled-DIs). A DI value above those dashed lines indicates a significant discriminative performance.
Figure 6
Figure 6
Discriminative performance across frequencies and step-sizes of the tone-pairs. (A) Phase-3 data sets were the same as used in Fig. 4 for both ferrets M and H. The trials from all of those ten sessions were pooled together to compute the discriminative index for each of the tone-pairs. The significant discriminative performances were confirmed at all the tone-pairs within four-octave training frequency range. (B) Discriminative index at each frequency separation is represented as mean±standard deviation (N=6). There is no significant difference in discriminative performance across the frequency separations between the component tones of the sequence. The horizontal dashed lines in (A) and (B) indicate the baseline performance (mean plus two standard deviation of the shuffled-DIs). A DI value above those dashed lines indicates a significant discriminative performance.

References

    1. Bartlett, J. C., and Dowling, W. J. (1980). “Recognition of transposed melodies: A key distance effect in development perspective,” J. Exp. Psychol. Hum. Percept. Perform. JPHPDH 6, 501–515.10.1037/0096-1523.6.3.501 - DOI - PubMed
    1. Brosch, M., Oshurkova, E., Bucks, C., and Scheich, H. (2006). “Influence of tone duration and intertone interval on the discrimination of frequency contours in a macaque monkey,” Neurosci. Lett. NELED5 406, 97–101.10.1016/j.neulet.2006.07.021 - DOI - PubMed
    1. Brosch, M., Selezneva, E., Bucks, C., and Scheich, H. (2004). “Macaque monkeys discriminate pitch relationships,” Cognition CGTNAU 91, 259–272.10.1016/j.cognition.2003.09.005 - DOI - PubMed
    1. Carterette, E. C., Friedman, M. P., and Cosmides, R. (1965). “Reaction time distributions in the detection of weak signal in noise,” J. Acoust. Soc. Am. JASMAN 38, 531–542.10.1121/1.1909737 - DOI - PubMed
    1. Cynx, J. (1993). “Auditory frequency generalization and a failure to find octave generalization in a songbird, The European starling (Sturnus vulgaris),” J. Comp. Psychol. JCOPDT 107, 140–146.10.1037/0735-7036.107.2.140 - DOI - PubMed

Publication types