Review
. 2010:33:173-202.
doi: 10.1146/annurev.neuro.051508.135256.

Emotion, cognition, and mental state representation in amygdala and prefrontal cortex

Affiliations
Review

Emotion, cognition, and mental state representation in amygdala and prefrontal cortex

C Daniel Salzman et al. Annu Rev Neurosci. 2010.

Abstract

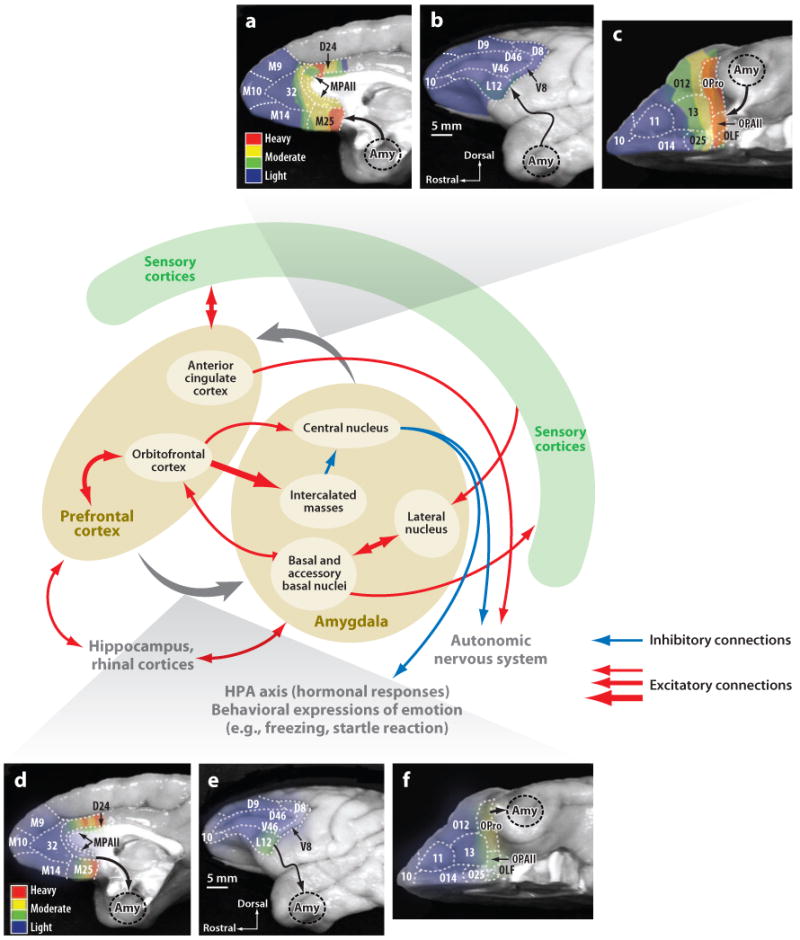
Neuroscientists have often described cognition and emotion as separable processes implemented by different regions of the brain, such as the amygdala for emotion and the prefrontal cortex for cognition. In this framework, functional interactions between the amygdala and prefrontal cortex mediate emotional influences on cognitive processes such as decision-making, as well as the cognitive regulation of emotion. However, neurons in these structures often have entangled representations, whereby single neurons encode multiple cognitive and emotional variables. Here we review studies using anatomical, lesion, and neurophysiological approaches to investigate the representation and utilization of cognitive and emotional parameters. We propose that these mental state parameters are inextricably linked and represented in dynamic neural networks composed of interconnected prefrontal and limbic brain structures. Future theoretical and experimental work is required to understand how these mental state representations form and how shifts between mental states occur, a critical feature of adaptive cognitive and emotional behavior.


Figures

Figure 1
Figure 1
Overview of anatomical connections of the amygdala and the prefrontal cortex (PFC). Schematic showing some (but not all) the main projections of the amygdala and the PFC. The interconnections of the amygdala and the PFC (and especially the OFC) are emphasized. (a–c) Summary of projections from the amygdala to the PFC (density of projections is color coded). (d–f) Summary of projections from the PFC to the amygdala (projection density is color coded). The complex circuitry between the amygdala and the OFC is also highlighted (red arrows connect the structures). Medial amygdala nuclei not shown. Many additional connections of both amygdala and PFC are not shown. Panels a–f were adapted with permission from figures 5 and 6 of Ghashghaei et al. (2007).
Figure 2
Figure 2
Neural representation of positive and negative valence in the amygdala and the OFC. (a) Trace-conditioning task involving both appetitive and aversive conditioning. Monkeys first centered gaze at a fixation point. Each experiment used novel abstract images as conditioned stimuli (CS). After fixating for 1 s, monkeys viewed a CS briefly, and following a 1.5-ms trace interval, unconditioned stimulus (US) delivery occurred. One CS predicted liquid reward, and a second CS predicted an aversive air puff directed at the face. After monkeys learned these initial associations, as indicated by anticipatory licking and blinking, the reinforcement contingencies were reversed. A third CS appeared on one-third of the trials, and it predicted either nothing or a much smaller reward throughout the experiment (not depicted in the figure). (b–e) Normalized and averaged population peri-stimulus time histograms (PSTHs) for positive and negative encoding amygdala (b,c) and OFC (d,e) neurons.
Figure 3
Figure 3
Amygdala neurons track state value during the fixation interval. (a,b) PSTHs aligned on fixation point onset from two example amygdala neurons (a, positive encoding; b, negative encoding) revealing responses to the fixation point consistent with their encoding state value. (c) Averaged and normalized responses to the fixation point for positive, negative, and nonvalue-coding amygdala neurons. (d) Histograms showing the number of cells that increased, decreased, or did not change their firing rates as a function of which valence the neuron encoded. Note that the fixation point may be understood as a mildly positive stimulus, so positive neurons tend to increase their response to it and negative neurons decrease their response. Adapted with permission from Belova et al. (2008, figure 2).
Figure 4
Figure 4
Valence-specific and valence-nonspecific encoding in the amgydala. (a–f). Normalized and averaged neural responses to reinforcement when it was expected (magenta) and unexpected (cyan) for reward (a,c,e) and air puff (b,d, f). Expectation modulated reinforcement responses for only one valence of reinforcement in some cells (a–d) but modulated reinforcement responses for both valences in many cells (e,f). These responses are consistent with a role of the amygdala in valence-specific processes, as well as valence-nonspecific processes, such as attention, arousal, and motivation. Adapted with permission from Belova et al. (2007, figure 3).
Figure 5
Figure 5
OFC neural responses during economic decision-making. (a) Behavioral task. Monkeys centered gaze at a fixation point and then viewed two visual tokens that indicate the type and quantity of juice reward being offered for potential saccades to each location (tokens, yellow and blue squares). After fixation point extinction, the monkey is free to choose which reward it wants by making a saccade to one of the targets. The amounts of juices offered of each type are titrated against each other to develop a full psychometric characterization of the monkey's preferences as a function of the two juice types offered. (b–e) Activity of four neurons revealing different types of response profiles. X-axis shows the quantity of each offer type. Chosen value neurons increased (b) or decreased (c) their firing when the value of their chosen option increased. Offer value neurons (d) increased their firing when the value of one of the juices offered increased. Juice neurons (e) increased their firing for trials with a particular juice type offered, independent of the amount of juice offered. Adapted from Padoa-Schioppa & Assad (2006, figures 1 and 3) with permission.
Figure 6
Figure 6
Single neurons encode rules in PFC. (a) Behavioral task. Monkeys grasped a lever to initiate a trial. They then had to center gaze at a fixation point while viewing a sample object, wait during a brief delay, and then view a test object. Two types of trials are depicted (double horizontal arrows). On match rule trials, monkeys had to release the lever if the test object matched the sample object. On nonmatch rule trials, monkeys had to release the lever if the test object did not match the sample. Otherwise, they had to hold the lever until a third object appeared that always required lever release. The rules in effect varied trial-by-trial by virtue of a different sensory cue (e.g., tones or juice) presented during viewing of the sample object. (b,c) PFC neurons encoding match (b) or nonmatch (c) rules. Activity was higher in relation to the rule in effect regardless of the stimuli shown. Adapted with permission from Wallis et al. (2001, figures 1 and 2).
Figure 7
Figure 7
PFC neurons encode rules in effect across time within a trial. Monkeys performed a task in which they had to match either the shape or color of two simultaneously presented objects with a sample object viewed earlier in the trial. Monkeys learned by trial and error whether a shape or color rule was in effect within a block of trials, and block switches were uncued to the monkey. (a,b) Two PFC cells that fired differentially depending on the rule in effect; activity differences emerged during the fixation (a) and intertrial intervals (ITI) (b). Activity is aligned on a start cue, which occurs before fixation on every trial. During the sample interval, one stimulus is presented over the fovea. During the decision interval, two stimuli are presented to the left and right; one matched the sample stimulus in color, and the other matched in shape. The correct choice can be chosen only if one has learned the rule in effect for the current block. (c) Distribution of activity differences between shape and color rules for each cell studied in each time interval of a trial. Each line corresponds to a single cell, and the solid parts of a line indicate when the cell fired differentially between color and shape blocks. Encoding of rules occurred in all time epochs, indicating that PFC neurons encode the rule in effect across time within a trial. Adapted with permission from Mansouri et al. (2006, figures 2 and 3).
Figure 8
Figure 8
The dynamics of context-dependent values. We consider a hypothetical variation of the experiment by Paton et al. (2006) in which there are two contexts. In the first context, CS A and B predict small rewards and punishments, respectively. In the second context, CS A and B are associated with large rewards and punishments. Six mental states now correspond to six valleys in the energy landscape. In panel 1, we consider the first trial of context 2, immediately after switching from context 1. Stimulus B has just been presented (not shown), and it is believed to predict small punishment. However a large punishment is delivered (not shown), and a surprise signal tilts the energy function (panel 2), inducing a transition to the neutral mental state of context 2 at the beginning of the next trial (panel 3; we assume for this example that the fixation interval has a neutral value). Now the system has already registered that it is in context 2. Consequently, the appearance of CS A tilts the energy landscape, and the mental state settles at a large positive value (panel 4). After CS disappearance, the network relaxes into the high positive value mental state of context 2. Thus the network does not need to relearn that CS A predicts a large reward because the network has already formed a representation for all the mental states contained within this simple experiment. Just knowing that the context has changed is sufficient for subjects to make an accurate prediction about impending reinforcement. For a detailed attractor model implementing this form of context dependency see Rigotti et al. (2010b).

Similar articles

Cited by

References

    1. Aggleton J, editor. The Amygdala—A Functional Analysis. Oxford: Oxford Univ. Press; 2000.
    1. Aggleton JP, Passingham RE. Syndrome produced by lesions of the amygdala in monkeys (Macaca mulatta) J Comp Physiol Psychol. 1981;95:961–77. - PubMed
    1. Amaral D, Price J, Pitkanen A, Carmichael S. Anatomical organization of the primate amygdaloid complex. In: Aggleton J, editor. The Amygdala: Neurobiological Aspects of Emotion, Memory, and Mental Dysfunction. New York: Wiley-Liss; 1992. pp. 1–66.
    1. Amaral DG, Behniea H, Kelly JL. Topographic organization of projections from the amygdala to the visual cortex in the macaque monkey. Neuroscience. 2003;118:1099–120. - PubMed
    1. Amaral DG, Dent JA. Development of the mossy fibers of the dentate gyrus: I. A light and electron microscopic study of the mossy fibers and their expansions. J Comp Neurol. 1981;195:51–86. - PubMed

Publication types

MeSH terms

LinkOut - more resources