. 2010 Apr 22;26(3):150-9.
doi: 10.3109/09593980903423111.

Do females with patellofemoral pain have abnormal hip and knee kinematics during gait?

Affiliations

Do females with patellofemoral pain have abnormal hip and knee kinematics during gait?

Gretchen B Salsich et al. Physiother Theory Pract. .

Abstract

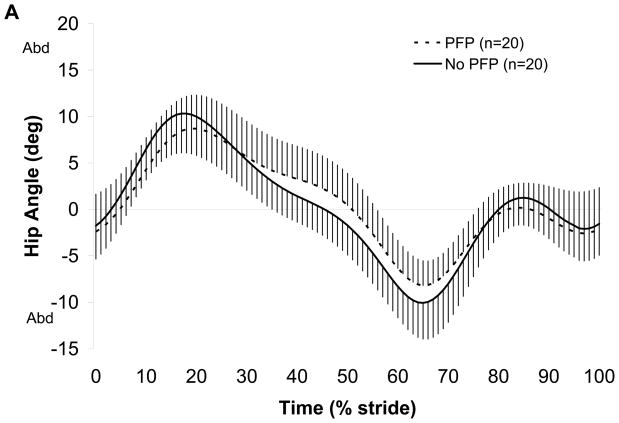
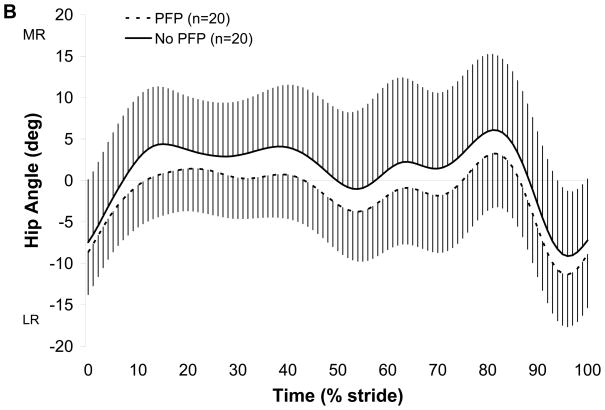
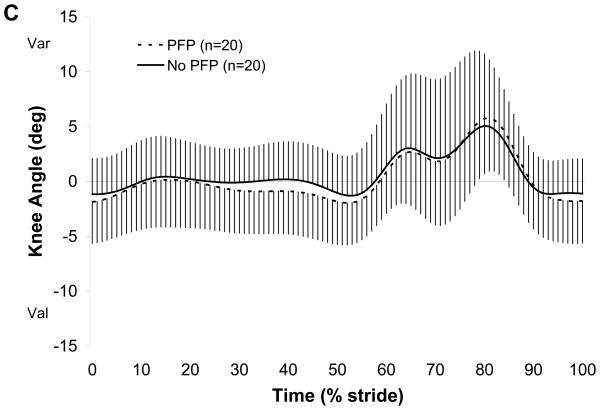
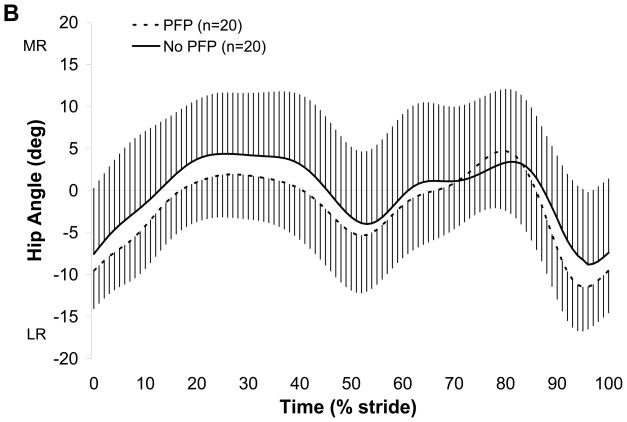
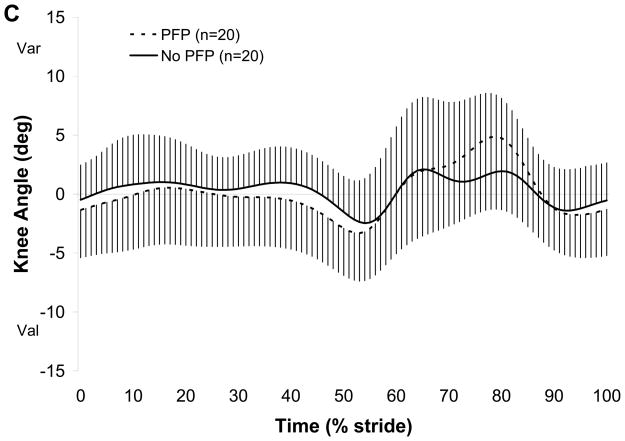
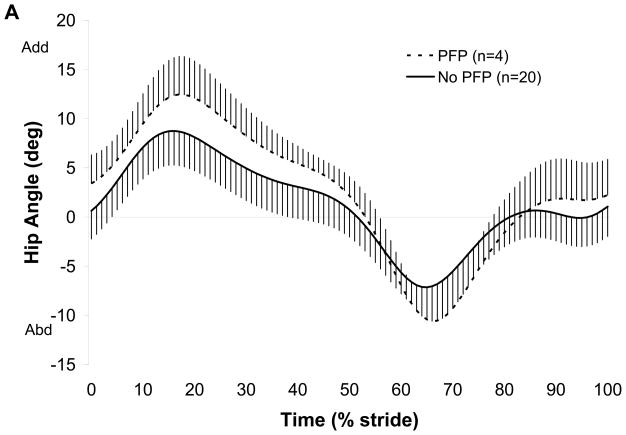
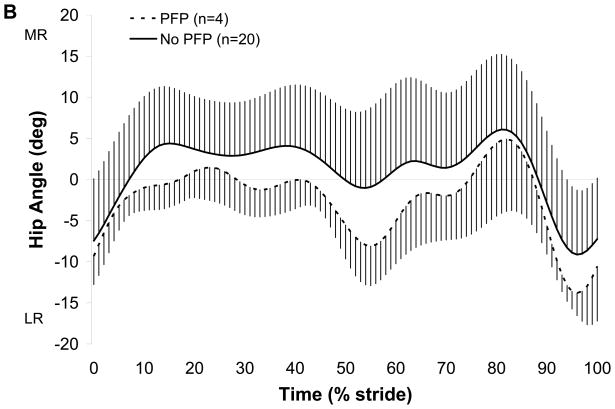
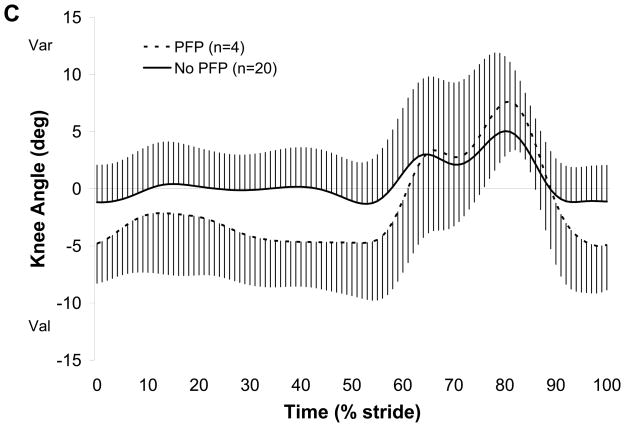
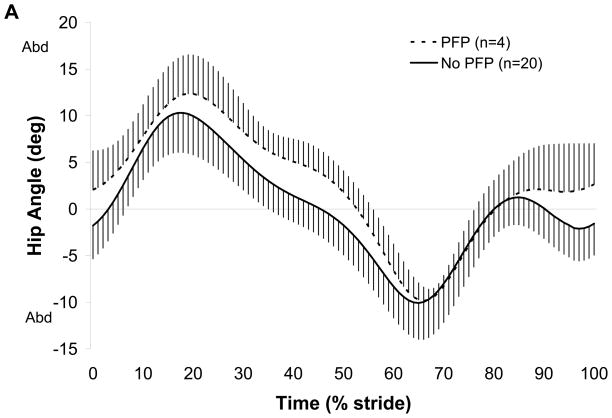
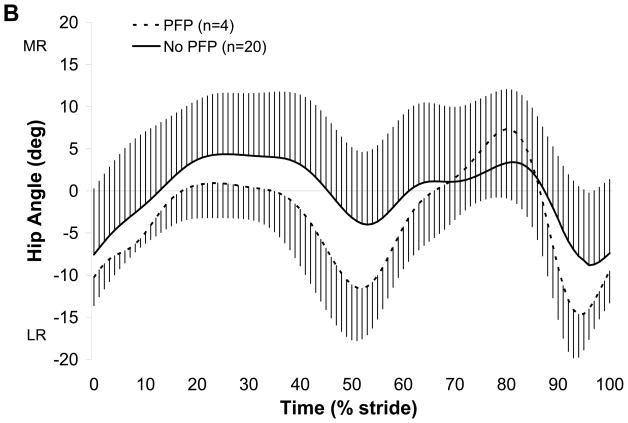
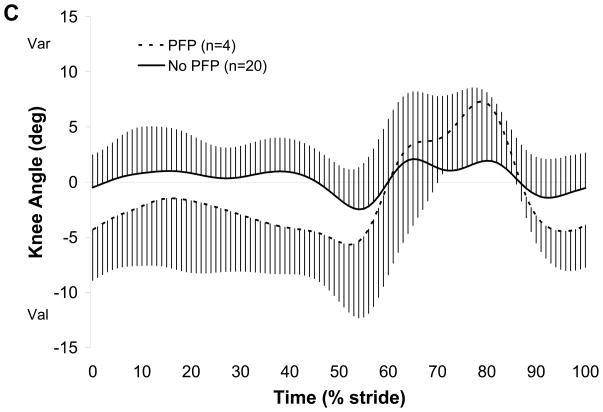
Our objective was to test the hypothesis that females with patellofemoral pain (PFP) have increased hip adduction, hip medial rotation, and knee valgus (medial collapse) during the stance phase of gait. Twenty subjects with PFP and 20 pain-free subjects participated. Subjects underwent three-dimensional motion analysis during free speed and fast speed walking. Hip frontal and transverse plane angles and knee frontal plane angles were calculated at two time points (peak knee extensor moment [PkMOM], and maximum knee extension/hyperextension angle [MxExt]) and averaged over three trials. Within each walking task, Student's t-tests compared group differences in all variables. A post hoc analysis was performed, which compared a subgroup of four PFP subjects (those whose pain level was above 30/100) to pain-free subjects. Initially, there were no group differences during free speed walking. During fast speed walking, subjects with PFP had less hip adduction at PkMOM and greater hip adduction at MxExt. The subgroup of PFP subjects had greater hip adduction at PkMOM and greater knee valgus at MxExt during free speed walking and greater hip adduction and knee valgus at MxExt during fast speed walking. During low-level tasks, frontal plane components of medial collapse were present at the hip and knee in a subgroup of PFP subjects with higher pain levels. Symptom behavior may be important in identifying individuals with medial collapse movement impairments.


Conflict of interest statement

Conflict of Interest

The authors have no financial affiliation (including research funding) or involvement with any commercial organization that has a direct financial interest in any matter included in this manuscript.

Figures

FIGURE 1
FIGURE 1
Ensemble averaged kinematic curves for free speed walking. A: Hip frontal plane angle, B: Hip transverse plane angle, C: Knee frontal plane angle. Time axis is expressed as a percentage of one stride. Thick lines represent the mean of n subjects; vertical error bars represent one standard deviation. Abd=abduction, Add=adduction, MR=medial rotation, LR=lateral rotation, Var=varus, Val=valgus. No group differences were detected.
FIGURE 1
FIGURE 1
Ensemble averaged kinematic curves for free speed walking. A: Hip frontal plane angle, B: Hip transverse plane angle, C: Knee frontal plane angle. Time axis is expressed as a percentage of one stride. Thick lines represent the mean of n subjects; vertical error bars represent one standard deviation. Abd=abduction, Add=adduction, MR=medial rotation, LR=lateral rotation, Var=varus, Val=valgus. No group differences were detected.
FIGURE 2
FIGURE 2
Ensemble averaged kinematic curves for fast speed walking. A: Hip frontal plane angle, B: Hip transverse plane angle, C: Knee frontal plane angle. Time axis is expressed as a percentage of one stride. Thick lines represent the mean of n subjects; vertical error bars represent one standard deviation. Abd=abduction, Add=adduction, MR=medial rotation, LR=lateral rotation, Var=varus, Val=valgus. *indicates hip adduction at PkMOM was less in the PFP group (p=.05) and hip adduction at MxExt was greater in the PFP group (p = .04).
FIGURE 2
FIGURE 2
Ensemble averaged kinematic curves for fast speed walking. A: Hip frontal plane angle, B: Hip transverse plane angle, C: Knee frontal plane angle. Time axis is expressed as a percentage of one stride. Thick lines represent the mean of n subjects; vertical error bars represent one standard deviation. Abd=abduction, Add=adduction, MR=medial rotation, LR=lateral rotation, Var=varus, Val=valgus. *indicates hip adduction at PkMOM was less in the PFP group (p=.05) and hip adduction at MxExt was greater in the PFP group (p = .04).
FIGURE 3
FIGURE 3. Subgroup analysis
Ensemble averaged kinematic curves for free speed walking. A: Hip frontal plane angle, B: Hip transverse plane angle, C: Knee frontal plane angle. Time axis is expressed as a percentage of one stride. Thick lines represent the mean of n subjects; vertical error bars represent one standard deviation. Abd=abduction, Add=adduction, MR=medial rotation, LR=lateral rotation, Var=varus, Val=valgus. *indicates hip adduction at PkMOM and knee valgus at MxExt were greater in the PFP group, p <.05.
FIGURE 4
FIGURE 4. Subgroup analysis
Ensemble averaged kinematic curves for fast speed walking. A: Hip frontal plane angle, B: Hip transverse plane angle, C: Knee frontal plane angle. Time axis is expressed as a percentage of one stride. Thick lines represent the mean of n subjects; vertical error bars represent one standard deviation. Abd=abduction, Add=adduction, MR=medial rotation, LR=lateral rotation, Var=varus, Val=valgus. *indicates hip adduction and knee valgus at MxExt were greater in the PFP group, p <.05.

Similar articles

Cited by

References

    1. Benoit DL, Ramsey DK, Lamontagne M, Xu L, Wretenberg P, Renstrom P. Effect of skin movement artifact on knee kinematics during gait and cutting motions measured in vivo. Gait & Posture. 2006;24:152–164. - PubMed
    1. Bolgla LA, Malone TR, Umberger BR, Uhl TL. Hip strength and hip and knee kinematics during stair descent in females with and without patellofemoral pain syndrome. Journal of Orthopaedic & Sports Physical Therapy. 2008;38:12–18. - PubMed
    1. Carlsson AM. Assessment of chronic pain. I. Aspects of the reliability and validity of the visual analogue scale. Pain. 1983;16:87–101. - PubMed
    1. Chesworth BM, Culham EG, Tata GE, Peat M. Validation of outcome measures in patients with patellofemoral syndrome. Journal of Orthopaedic & Sports Physical Therapy. 1989;10:302–308. - PubMed
    1. Chumanov ES, Wall-Scheffler C, Heiderscheit BC. Gender differences in walking and running on level and inclined surfaces. Clinical Biomechanics. 2008;23:1260–1268. - PubMed

Publication types