Transient peripheral immune response and central nervous system leaky compartmentalization in a viral model for multiple sclerosis
- PMID: 20331618
- PMCID: PMC8094647
- DOI: 10.1111/j.1750-3639.2010.00383.x
Transient peripheral immune response and central nervous system leaky compartmentalization in a viral model for multiple sclerosis
Abstract
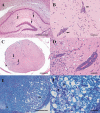
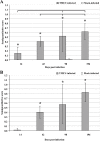
Theiler's virus-induced demyelination represents an important animal model to study the chronic-progressive form of multiple sclerosis (MS). The aim of the present study was to identify specific genes and pathways in the deep cervical lymph node (cLN) and spleen of experimentally infected SJL-mice, using DNA microarrays. Analyses identified 387 genes in the deep cLN and only 6 genes in the spleen of infected animals. The lymph node presented 27.4% of genes with fold changes +/-1.5 at 14 days post infection (dpi) and a reduced transcription at later time points. K-means clustering analyses resulted in five clusters. Accordingly, functional annotation revealed that the B-cell immune response pathway was the most up-regulated cluster at the early phase. Additionally, an increase of CD68- and lysozyme-positive cells in the deep cLN was observed by immunohistochemistry. Polioencephalitis was most intense at 14 dpi, and the spinal cord demyelinating leukomyelitis started at 42 dpi. In summary, early gene expression is indicative of virus-trigged immune responses in the central nervous system (CNS)-draining lymph node. The decreased gene transcription in the deep cLN during the chronic phase and the low number of spleen genes supports the hypothesis of a compartmentalized inflammation within the CNS, as described in progressive MS.
Figures


Similar articles
-
Kallikrein 6 regulates early CNS demyelination in a viral model of multiple sclerosis.Brain Pathol. 2012 Sep;22(5):709-22. doi: 10.1111/j.1750-3639.2012.00577.x. Epub 2012 Mar 21. Brain Pathol. 2012. PMID: 22335454 Free PMC article.
-
The CD4-mediated immune response is critical in determining the outcome of infection using Theiler's viruses with VP1 capsid protein point mutations.Virology. 2000 Sep 15;275(1):9-19. doi: 10.1006/viro.2000.0493. Virology. 2000. PMID: 11017783
-
The effect of B-cell depletion in the Theiler's model of multiple sclerosis.J Neurol Sci. 2015 Dec 15;359(1-2):40-7. doi: 10.1016/j.jns.2015.10.012. Epub 2015 Oct 8. J Neurol Sci. 2015. PMID: 26671084
-
Immune mechanisms of Theiler's virus-induced demyelination.Exp Mol Med. 1999 Sep 30;31(3):115-21. doi: 10.1038/emm.1999.19. Exp Mol Med. 1999. PMID: 10551258 Free PMC article. Review. No abstract available.
-
Viral mouse models used to study multiple sclerosis: past and present.Arch Virol. 2021 Apr;166(4):1015-1033. doi: 10.1007/s00705-021-04968-5. Epub 2021 Feb 13. Arch Virol. 2021. PMID: 33582855 Free PMC article. Review.
Cited by
-
Drainage of cells and soluble antigen from the CNS to regional lymph nodes.J Neuroimmune Pharmacol. 2013 Sep;8(4):840-56. doi: 10.1007/s11481-013-9470-8. Epub 2013 May 22. J Neuroimmune Pharmacol. 2013. PMID: 23695293 Free PMC article. Review.
-
Aging and neuroinflammation: Changes in immune cell responses, axon integrity, and motor function in a viral model of progressive multiple sclerosis.Aging Cell. 2021 Sep;20(9):e13440. doi: 10.1111/acel.13440. Epub 2021 Aug 6. Aging Cell. 2021. PMID: 34355492 Free PMC article.
-
Facets of Theiler's Murine Encephalomyelitis Virus-Induced Diseases: An Update.Int J Mol Sci. 2019 Jan 21;20(2):448. doi: 10.3390/ijms20020448. Int J Mol Sci. 2019. PMID: 30669615 Free PMC article. Review.
-
Host genetic diversity drives variable central nervous system lesion distribution in chronic phase of Theiler's Murine Encephalomyelitis Virus (TMEV) infection.PLoS One. 2021 Aug 20;16(8):e0256370. doi: 10.1371/journal.pone.0256370. eCollection 2021. PLoS One. 2021. PMID: 34415947 Free PMC article.
-
Interferon-stimulated genes-essential antiviral effectors implicated in resistance to Theiler's virus-induced demyelinating disease.J Neuroinflammation. 2015 Dec 24;12:242. doi: 10.1186/s12974-015-0462-x. J Neuroinflammation. 2015. PMID: 26703877 Free PMC article.
References
-
- Abbott NJ (2004) Evidence for bulk flow of brain interstitial fluid: significance for physiology and pathology. Neurochem Int 45:545–552. - PubMed
-
- Bakker ABH, Hoek RM, Cerwenka A, Blom B, Lucian L, McNeil T et al (2000) DAP12‐deficient mice fail to develop autoimmunity due to impaired antigen priming. Immunity 13:345–353. - PubMed
-
- Banchereau J, Briere F, Caux C, Davoust J, Lebecque S, Liu Y‐J et al (2000) Immunobiology of dendritic cells. Ann Rev Immunol 18:767–811. - PubMed
Publication types
MeSH terms
LinkOut - more resources
Full Text Sources
Medical

