. 2010 Aug;12(8):1144-57.
doi: 10.1111/j.1462-5822.2010.01460.x. Epub 2010 Mar 12.

Cell permeabilization by poliovirus 2B viroporin triggers bystander permeabilization in neighbouring cells through a mechanism involving gap junctions

Affiliations

Cell permeabilization by poliovirus 2B viroporin triggers bystander permeabilization in neighbouring cells through a mechanism involving gap junctions

Vanesa Madan et al. Cell Microbiol. 2010 Aug.

Abstract

Poliovirus 2B protein is a well-known viroporin implicated in plasma membrane permeabilization to ions and low-molecular-weight compounds during infection. Translation in mammalian cells expressing 2B protein is inhibited by hygromycin B (HB) but remains unaffected in mock cells, which are not permeable to the inhibitor. Here we describe a previously unreported bystander effect in which healthy baby hamster kidney (BHK) cells become sensitive to HB when co-cultured with a low proportion of cells expressing poliovirus 2B. Viroporins E from mouse hepatitis virus, 6K from Sindbis virus and NS4A protein from hepatitis C virus were also able to permeabilize neighbouring cells to different extents. Expression of 2B induced permeabilization of neighbouring cell lines other than BHK. We found that gap junctions are responsible mediating the observed bystander permeabilization. Gap junctional communication was confirmed in 2B-expressing co-cultures by fluorescent dye transfer. Moreover, the presence of connexin 43 was confirmed in both mock and 2B-transfected cells. Finally, inhibition of HB entry to neighbouring cells was observed with 18alpha-glycyrrhethinic acid, an inhibitor of gap junctions. Taken together, these findings support a mechanism involving gap junctional intercellular communication in the bystander permeabilization effect observed in healthy cells co-cultured with poliovirus 2B-expressing cells.


Figures

Figure 1
Figure 1
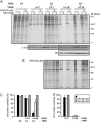
Expression of PV 2B protein in BHK cells induces permeabilization of neighbouring cells to HB. BHK cells were electroporated with in vitro synthesized RNA from the plasmids pT7 repC+2B or pT7 repC+2BC. Different proportions of electroporated cells (as indicate in the figure, * BHK) were mixed with mock BHK cells and seeded in 24‐well plates. Cell density (ρ) in each well was approximately 1.9 × 105 cells cm−2. At different times after transfection, proteins were labelled with [35S] Met/Cys in the absence (−) or presence (+) of 1 mM HB for 40 min. Samples were processed by SDS‐PAGE (17.5%) followed by fluorography and autoradiography. A. Membrane permeabilization of neighbouring cells (mock cells) assayed by the inhibition of translation as a result of HB entry induced by 2B protein at 8 h post electroporation (hpe) (a representative experiment). All of the cells expressing 2B are permeable to HB (proportion 1; cell ρ = 1.9 × 105 cells cm−2). A Western blot using polyclonal antibodies against 2B protein was performed to show 2B expression and its proportional decrease with dilutions of transfected cells (lower panel). B. Immunofluorescence staining at 8 hpe in a sample in which only 25% of BHK cells expressed 2B protein. Cells were fixed, permeabilized and double stained with anti‐2B antibodies (green) and DAPI (nuclei labelling, blue). The panel shows merged immunofluorescence and phase‐contrast images. Scale bar, 10 µM. C. Statistical analysis of membrane permeabilization of neighbouring cells caused by 2B and its precursor, 2BC, at 5 (left graph) and 8 hpe (right graph). Each bar represents the percentage of cellular protein synthesis in HB‐treated cells compared with untreated cells. Cellular proteins bands were quantified by densitometry. All data are shown as the mean ± SD of at least three independent experiments. (5 hpe; **P < 0.01, *P < 0.05, 8 hpe; **P < 0.001, *P < 0.01, + P < 0.05).
Figure 2
Figure 2
Expression of different viroporins induces permeabilization of neighbouring cells to HB to different extents. BHK cells were electroporated with in vitro synthesized RNA from the plasmids pT7 repC+2B, pT7 repC+E, pT7 repC+NS4A or pT7 repC+6K. Transfected cells (* BHK) were mixed with mock cells in equal proportions (ratio 1:1; total cell ρ = 1.9 × 105 cells cm−2) or seeded separately (proportion 1; total cell ρ = 8 × 104 cells cm−2) in 24‐well plates. As a negative control, cells were transfected with RNA from pT7 repC (encoding Sindbis virus capsid protein). At 8 h post electroporation (hpe) (cells expressing only C protein, 2B, E or NS4A protein co‐cultured with mock cells) or 16 hpe (cells expressing 6K co‐cultured with mock cells), proteins were metabolically labelled in the absence (−) or presence (+) of 1 mM HB for 40 min. Samples were processed by SDS‐PAGE (17.5%). To measure membrane permeabilization of neighbouring cells, protein synthesis in those cells was quantified by densitometry of bands corresponding to actin, * (a). Permeabilization of cells expressing either C protein or viroporins is represented as the decrease in protein synthesis which was quantified by densitometry of bands corresponding to C protein (b). Numbers below the gel indicate the percentage of cell protein synthesis in HB‐treated cells compared with untreated cells. Most cells expressing viroporins 2B, E or 6K were permeable to HB. A Western blot using monoclonal antibodies against α‐tubulin was performed as a control for protein load (lower panel).
Figure 3
Figure 3
Expression of 2B viroporin in BHK cells promotes translation inhibition by HB in other cell lines. Different proportions of BHK cells, transfected with RNA from SV replicon encoding 2B protein or C (* BHK), and Huh‐7 cells (mock cells) were mixed (total cell ρ = 1.9 × 105 cells cm−2). Permeabilization of neighbouring Huh‐7 cells to HB was analysed at 8 h post electroporation (hpe) by metabolic labelling of proteins in the absence (−) or presence (+) of 1 mM HB for 40 min. Protein synthesis in Huh‐7 cells (a) was quantified by densitometry of bands corresponding to a specific protein of Huh‐7 cells (*). As a negative control, a high proportion of BHK cells expressing SV C protein were mixed with mock Huh‐7 cells (3 BHK:1 Huh‐7). Permeabilization of BHK cells expressing 2B was quantified by densitometry of the SV C protein band (b). Numbers below the gel indicate the percentage of protein synthesis in HB‐treated cells compared with untreated cells. A Western blot using monoclonal antibodies against α‐tubulin was performed as a control for protein load (lower panel).
Figure 4
Figure 4
Permeabilization of neighbouring cells to HB depends on the cell line that expresses 2B. Huh‐7 cells were electroporated with SV‐derived replicons encoding C+2B or only C protein (negative control) as described in Experimental procedures. Different proportions of transfected cells (* Huh‐7) were mixed with mock Huh‐7 cells (total cell ρ = 1.9 × 105 cells cm−2) or seeded separately (proportion 1/2; total cell ρ = 8 × 104 cells cm−2). At 8 h post electroporation (hpe), permeabilization of neighbouring Huh‐7 cells was assayed by the inhibition of translation as a result of HB entry induced by 2B protein. Protein synthesis in Huh‐7 cells (a) was quantified by densitometry of bands corresponding to actin (*). Permeabilization of Huh‐7 cells expressing 2B was quantified by densitometry of SV C protein band (b). Numbers below the gel indicate the percentage of protein synthesis in HB‐treated cells compared with untreated cells. A Western blot using monoclonal antibodies against α‐tubulin was performed as a control for protein load (lower panel).
Figure 5
Figure 5
Permeabilization of neighbouring cells to HB is dependent on cell–cell contact. A. A fixed proportion of transfected (with replicons encoding C+2B or C alone; * BHK) and mock cells (*BHK : BHK, 1:3; total number of cells = 4 × 105; cell ρ at maximum confluence = 20 × 104 cells cm−2) was seeded on plates with different growth areas (2, 3.8, 11.8 and 19.5 cm2). At 8 h post electroporation (hpe), permeabilization of mock cells was assayed by the inhibition of translation as a result of HB entry induced by 2B protein. Protein synthesis in mock cells was quantified by densitometry of bands corresponding to actin (*). Numbers below the gel indicate the percentage of protein synthesis in HB‐treated cells compared with untreated cells. As a control for protein load, α‐tubulin was detected by Western blotting (lower panel). B. Permeabilization of BHK cells is not induced when cell contact with 2B‐expressing cells is not established. Schematic drawings of culture plates (growth area = 11.8 cm2) containing a central ring that divides the plate into an independent inner (i) chamber (growth area ≈ 2 cm2) and an outer (o) concentric region (left). Cells transfected with replicons encoding C+2B or C alone were seeded on the outer region of the plate (grey) and mock cells were independently seeded into the central chamber (white). Once cells were settled, the central ring was removed in such a way that all cells shared the same culture medium. At 8 hpe, cells were metabolically labelled for 40 min in the absence (−) or presence (+) of 1 mM HB. Transfected and mock cells were independently collected in loading buffer by first replacing the central ring the culture plate. Mock cells (from the central chamber) and transfected cells (outer region) expressing C+2B or C (negative control) were loaded separately, as indicated in the figure (right panel), and processed by SDS‐PAGE. It can be observed that only cells that express 2B protein are permeable to HB. As a protein loading control, α‐tubulin was detected by Western blotting (lower panel). C. 2B protein is not released into the culture medium. Cells expressing C alone, 2B or E protein from MHV‐A59 (positive control) and their respective culture media were collected separately at 8 hpe. Cells were resuspended in loading buffer while culture media were centrifuged and proteins from supernatants (S) were precipitated using trichloroacetic acid (see Experimental procedures) and resuspended in loading buffer. The presence of viral proteins in cells and supernatants was analysed by Western blotting using rabbit polyclonal antibodies directed against C, 2B and E. The absence of cellular proteins in supernatant was confirmed by Western blotting using monoclonal antibodies specific for α‐tubulin.
Figure 6
Figure 6
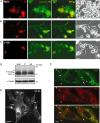
Gap junction‐mediated fluorescent dye transfer. A–C. Mock BHK cells (A) or cells electroporated with SV replicon encoding C (B) or C+2B proteins (C) were preloaded with DiI and calcein AM fluorescent probes and mixed with unlabelled non‐transfected cells as indicated in Experimental procedures. Diffusion of calcein was analysed at 8 h post electroporation (hpe) in living cells. Calcein spread to DiI‐negative cells, indicating the presence of intercellular coupling (A–C, merged panels), while DiI was retained in the preloaded cells (A–C, left panels). The right‐hand panels show phase‐contrast images of these cells. Bars, 10 µm. D. Cx 43 levels in transfected cells. Expression of Cx 43 in non‐transfected cells and cells expressing C or C+2B was analysed by Western blotting using a rabbit anti‐Cx 43 antibody. Detection of α‐tubulin served as a loading control. P‐Cx43, phosphorylated forms of Cx 43. E and F. Cx 43 distribution in BHK cells. Immunofluorescence of non‐transfected cells (E) using a rabbit anti‐Cx 43 antibody reveals Cx 43 staining of intracellular and plasma membranes (arrows). Bar, 10 µm. Immunofluorescence staining at 8 hpe in a sample in which only 25% of BHK cells expressed 2B protein (F). To detect the 2B‐expressing cells (labelled with a white asterisk, *), ‘mitotracker’, a vital marker of mitochondria, was used. 2B expression induces a perinuclear redistribution of mitochondria that allows us to discriminate the transfected from the non‐transfected cells, which show a normal mitochondrial pattern (Madan et al., 2008). Bar, 5 µm.
Figure 7
Figure 7
Permeabilization of neighbouring cells to HB is inhibited by 18α‐glycyrrhetinic acid. A and B. A fixed proportion of transfected cells (with replicons encoding C+2B or C alone; * BHK) and mock cells (BHK) was mixed (*BHK : BHK, 1:3; total cell ρ = 1.95 × 105 cells cm−2) or seeded separately (proportion 3/4 BHK; total cell ρ = 1.46 × 105 cells cm−2 and 1/4 *BHK; total cell ρ = 4.8 × 104 cells cm−2) in 24‐well plates in the absence or presence of 25 µM (A) or 50 µM (B) 18α‐glycyrrhetinic acid (18‐α‐GA). At 7 h post electroporation (hpe), proteins were metabolically labelled in the absence (−) or presence (+) of 1 mM HB and 18‐α‐GA for 40 min. As protein loading controls, α‐tubulin and 2B protein from 2B‐expressing cells or co‐cultured cells were detected by Western blotting (A, lower panel). C. Membrane permeabilization inhibition of neighbouring cells (BHK) by 18‐α‐GA at 8 hpe (left graph). Each bar represents the percentage of protein synthesis in HB‐treated cells compared with untreated cells. Cellular protein bands were quantified by densitometry. The effect of 18‐α‐GA on membrane permeabilization in 2B‐expressing BHK cells is shown in the right‐hand graph. C protein bands were quantified by densitometry. All data are represented as the mean ± SD of at least three independent experiments.
Figure 8
Figure 8
Model of bystander permeabilization to HB. Model illustrating that 2B‐expressing cells trigger HB entry in untransfected cells. 1. First, impermeable HB enters cells permeabilized by 2B protein and inhibits translation (see Discussion). 2. HB diffuses through gap junctions to non‐transfected cells in close contact with 2B‐expressing cells, resulting in inhibition of protein synthesis of these cells. 3. HB is transferred to a larger number of neighbouring cells.

Similar articles

Cited by

References

    1. Agirre, A. , Barco, A. , Carrasco, L. , and Nieva, J.L. (2002) Viroporin‐mediated membrane permeabilization. Pore formation by nonstructural poliovirus 2B protein. J Biol Chem 277: 40434–40441. - PubMed
    1. Aldabe, R. , and Carrasco, L. (1995) Induction of membrane proliferation by poliovirus proteins 2C and 2BC. Biochem Biophys Res Commun 206: 64–76. - PubMed
    1. Aldabe, R. , Barco, A. , and Carrasco, L. (1996) Membrane permeabilization by poliovirus proteins 2B and 2 BC. J Biol Chem 271: 23134–23137. - PubMed
    1. Asklund, T. , Appelskog, I.B. , Ammerpohl, O. , Langmoen, I.A. , Dilber, M.S. , Aints, A. , et al (2003) Gap junction‐mediated bystander effect in primary cultures of human malignant gliomas with recombinant expression of the HSVtk gene. Exp Cell Res 284: 185–195. - PubMed
    1. Barco, A. , and Carrasco, L. (1995) A human virus protein, poliovirus protein 2 BC, induces membrane proliferation and blocks the exocytic pathway in the yeast Saccharomyces cerevisiae . EMBO J 14: 3349–3364. - PMC - PubMed

Publication types

MeSH terms

Substances