. 2010 Mar;19 Suppl 1(Suppl 1):266-76.
doi: 10.1111/j.1365-294X.2009.04487.x.

Comparative genomics based on massive parallel transcriptome sequencing reveals patterns of substitution and selection across 10 bird species

Affiliations

Comparative genomics based on massive parallel transcriptome sequencing reveals patterns of substitution and selection across 10 bird species

Axel Künstner et al. Mol Ecol. 2010 Mar.

Erratum in

  • Mol Ecol. 2011 Jul;20(13):2871

Abstract

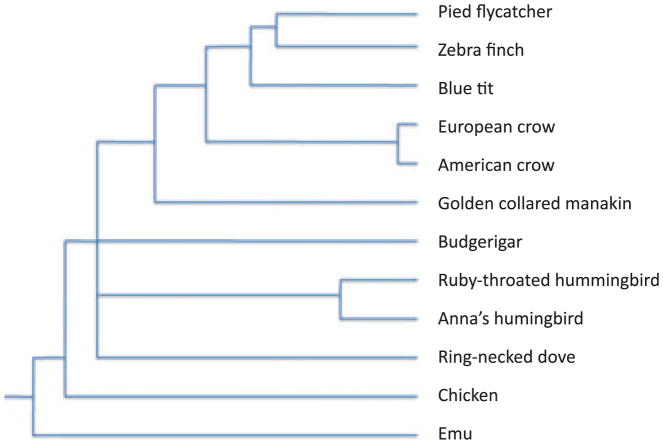
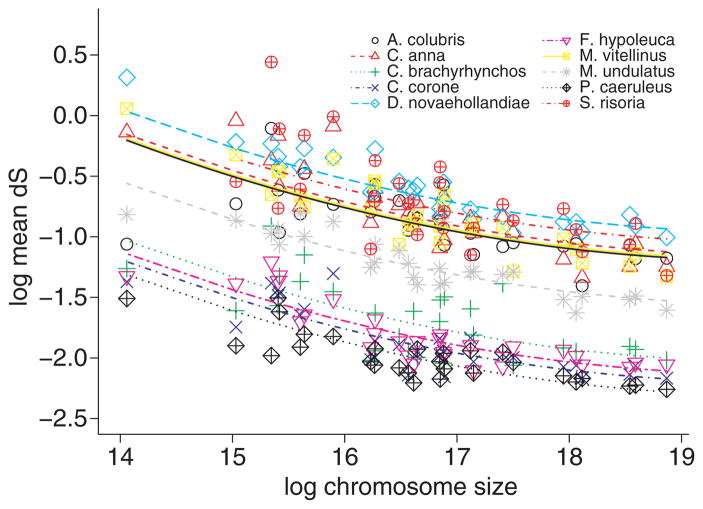
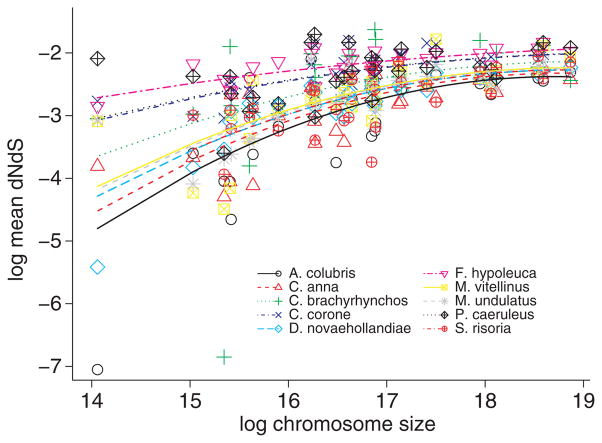
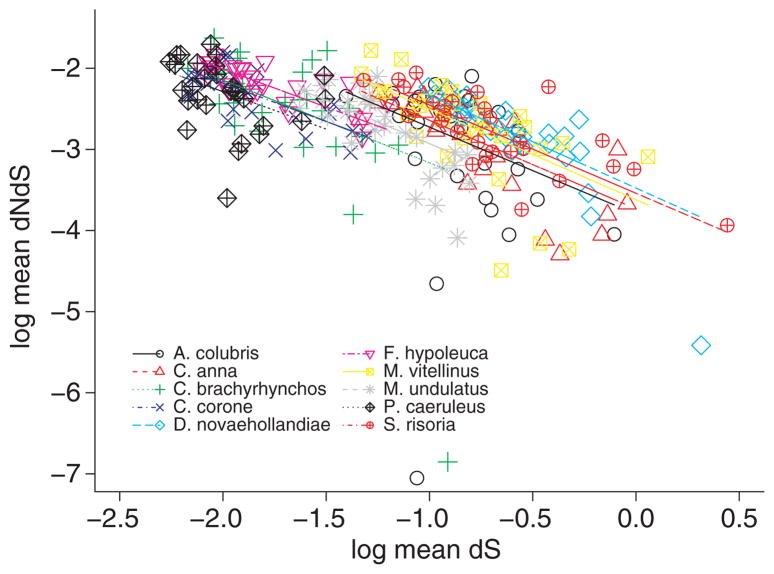
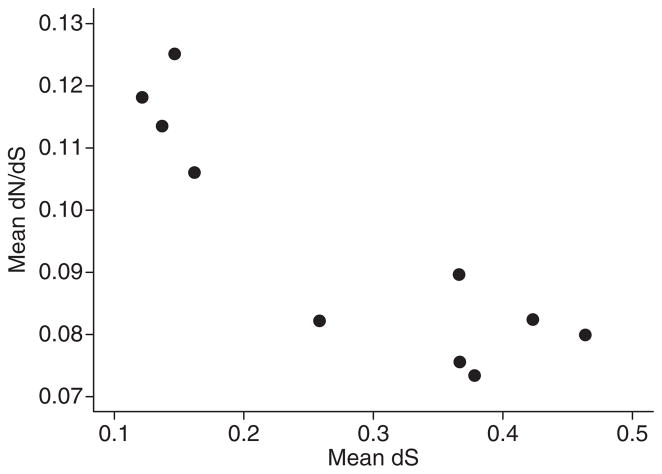
Next-generation sequencing technology provides an attractive means to obtain large-scale sequence data necessary for comparative genomic analysis. To analyse the patterns of mutation rate variation and selection intensity across the avian genome, we performed brain transcriptome sequencing using Roche 454 technology of 10 different non-model avian species. Contigs from de novo assemblies were aligned to the two available avian reference genomes, chicken and zebra finch. In total, we identified 6499 different genes across all 10 species, with approximately 1000 genes found in each full run per species. We found evidence for a higher mutation rate of the Z chromosome than of autosomes (male-biased mutation) and a negative correlation between the neutral substitution rate (d(S)) and chromosome size. Analyses of the mean d(N)/d(S) ratio (omega) of genes across chromosomes supported the Hill-Robertson effect (the effect of selection at linked loci) and point at stochastic problems with omega as an independent measure of selection. Overall, this study demonstrates the usefulness of next-generation sequencing for obtaining genomic resources for comparative genomic analysis of non-model organisms.


Conflict of interest statement

Conflicts of interest

The authors have no conflict of interest to declare and note that the sponsors of the issue had no role in the study design, data collection and analysis, decision to publish, or preparation of the manuscript.

Figures

Fig. 1
Fig. 1
A schematic phylogenetic tree indicating the approximate relationships between species included in the study, following Hackett et al. (2008). As the precise topology is not critical for the purpose of this study, controversial nodes are not shown resolved. Branch lengths are not drawn according to scale.
Fig. 2
Fig. 2
Proportion of contigs that aligned to different parts of protein-coding genes, including coding region (CDS), 5′ and 3′ untranslated (UTR) regions, and regions 1 kb upstream and downstream, and not annotated regions respectively of zebra finch-defined UTR regions. snoRNA, small nuclear RNA; miR-NA, micro-RNA; rRNA, ribosomal RNA; miscRNA, miscellaneous RNA; pseude, pseudogenes.
Fig. 3
Fig. 3
Proportion of contigs that aligned to different parts of non-coding RNA-genes and pseudogenes, as defined from alignment to the ENSEMBL-modelled zebra finch genome predictions.
Fig. 4
Fig. 4
The distribution of contig coverage in different parts of the CDS region of protein-coding genes. The length of all genes was normalized and the coverage calculated in 10% bins.
Fig. 5
Fig. 5
The relationship between substitution rate (log mean dS) and chromosome size (log2) in pairwise comparisons including in each case zebra finch.
Fig. 6
Fig. 6
The relationship between log mean ω (dN/dS) and (log2) chromosome size in pairwise comparisons including in each case zebra finch. Lines represent predicted values of the full model including different slopes (model 1, Table 6, that despite of being less parsimonious allows a more detailed inspection of the data.
Fig. 7
Fig. 7
The relationship between mean ω (dN/dS) and dS in pairwise comparisons including in each case zebra finch.
Fig. 8
Fig. 8
The relationship between log mean ω (dN/dS) and (log2) chromosome size in pairwise comparisons including in each case zebra finch. Lines represent predicted values of the full model including different slopes (model 1, Table 6) that despite of being less parsimonious allows a more detailed inspection of the data.

References

    1. Abzhanov A, Protas M, Grant BR, Grant PR, Tabin CJ. Bmp4 and morphological variation of beaks in Darwin’s finches. Science. 2004;305:1462–1465. - PubMed
    1. Axelsson E, Smith NGC, Sundstrom H, Berlin S, Ellegren H. Male-biased mutation rate and divergence in autosomal, Z-linked and W-linked introns of chicken and turkey. Molecular Biology and Evolution. 2004;21:1538–1547. - PubMed
    1. Axelsson E, Webster MT, Smith NGC, Burt DW, Ellegren H. Comparison of the chicken and turkey genomes reveals a higher rate of nucleotide divergence on microchromosomes than macrochromosomes. Genome Research. 2005;15:120–125. - PMC - PubMed
    1. Barakat A, DiLoreto DS, Zhang Y, et al. Comparison of the transcriptomes of American chestnut (Castanea dentata) and Chinese chestnut (Castanea mollissima) in response to the chestnut blight infection. BMC Plant Biology. 2009;9:11. - PMC - PubMed
    1. Bartosch-Harlid A, Berlin S, Smith NGC, Moller AP, Ellegren H. Life history and the male mutation bias. Evolution. 2003;57:2398–2406. - PubMed

Publication types

LinkOut - more resources