Comparative Study
. 2010 Apr 15;123(Pt 8):1343-51.
doi: 10.1242/jcs.066464. Epub 2010 Mar 23.

Insulin regulates alveolar epithelial function by inducing Na+/K+-ATPase translocation to the plasma membrane in a process mediated by the action of Akt

Affiliations
Comparative Study

Insulin regulates alveolar epithelial function by inducing Na+/K+-ATPase translocation to the plasma membrane in a process mediated by the action of Akt

Alejandro P Comellas et al. J Cell Sci. .

Abstract

Stimulation of Na(+)/K(+)-ATPase translocation to the cell surface increases active Na(+) transport, which is the driving force of alveolar fluid reabsorption, a process necessary to keep the lungs free of edema and to allow normal gas exchange. Here, we provide evidence that insulin increases alveolar fluid reabsorption and Na(+)/K(+)-ATPase activity by increasing its translocation to the plasma membrane in alveolar epithelial cells. Insulin-induced Akt activation is necessary and sufficient to promote Na(+)/K(+)-ATPase translocation to the plasma membrane. Phosphorylation of AS160 by Akt is also required in this process, whereas inactivation of the Rab GTPase-activating protein domain of AS160 promotes partial Na(+)/K(+)-ATPase translocation in the absence of insulin. We found that Rab10 functions as a downstream target of AS160 in insulin-induced Na(+)/K(+)-ATPase translocation. Collectively, these results suggest that Akt plays a major role in Na(+)/K(+)-ATPase intracellular translocation and thus in alveolar fluid reabsorption.


Figures

Fig. 1.
Fig. 1.
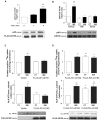
Insulin increases AFR in isolated perfused rat lungs, and Na+/K+-ATPase activity and recruitment to the plasma membrane in isolated rat ATII cells. (A) Rats were injected with insulin (0.1, 0.3 and 1.0 units/kilo) or pretreated with propranolol (P; 10−4 M) for 30 minutes and then injected with insulin 30 minutes before starting the experiment. AFR was measured using the isolated perfused lung model described in Materials and Methods (n=5). (B) Serum-starved ATII cells were incubated in the presence or absence of insulin (1-100 nM) for 30 minutes. Na+/K+-ATPase activity was measured by 86Rb uptake (n=6). (C) Serum-starved ATII cells were incubated in the presence of insulin (1-100 nM) for 30 minutes. Na+/K+-ATPase recruitment to the plasma membrane was determined by biotin labeling of surface proteins, followed by streptavidin pull-down and western blot analysis using a specific anti-α1-subunit antibody. A representative immunoblot is shown (n=3). (D) Serum-starved ATII cells were incubated in the presence or absence of insulin (100 nM) for different periods of time. Na+/K+-ATPase recruitment to the plasma membrane was determined as described in C. A representative immunoblot is shown (n=4). (E) Serum-starved ATII cells were treated with insulin (100 nM) for 30 minutes in the presence or absence of amiloride (AMI; 1 μM, 30 minutes preincubation). Na+/K+-ATPase recruitment to the plasma membrane was determined as described in C. A representative immunoblot is shown (n=3). Values are expressed as mean ± s.e.m. *P<0.05, **P<0.01. CT, control.
Fig. 2.
Fig. 2.
Insulin increases Na+/K+-ATPase recruitment to the plasma membrane in a PI3K-dependent way. (A) Serum-starved ATII cells were pretreated with genistein (G; 10 μM, 30 minutes preincubation) and then incubated in the absence (CT) or presence of insulin (INS; 100 nM) for 30 minutes. Na+/K+-ATPase recruitment to the plasma membrane was determined as described in Fig. 1C. A representative immunoblot is shown (n=3). (B) Serum-starved ATII cells were pretreated with wortmannin (WM; 100 nM, 30 minutes preincubation) and incubated in the presence or absence of insulin (100 nM) for 30 minutes. Na+/K+-ATPase recruitment to the plasma membrane was determined as described in Fig. 1C. A representative immunoblot is shown (n=3). (C) Serum-starved ATII cells were pretreated with LY 294002 (LY; 25 μM, 30 minutes preincubation) and incubated in the presence or absence of insulin (100 nM) for 30 minutes. Na+/K+-ATPase recruitment to the plasma membrane was determined as described in Fig. 1C. A representative immunoblot is shown. Values are expressed as mean ± s.e.m. **P<0.01.
Fig. 3.
Fig. 3.
Insulin-stimulated Na+/K+-ATPase recruitment requires Akt. (A) Serum-starved ATII cells were incubated with 100 nM insulin (INS) for 1 or 5 minutes. Then, phosphorylated Akt (p-Akt) or the total amount of Akt was measured by western blot analysis of aliquots of cell lysate containing equal amounts of protein. A representative blot is shown (n=3). (B) Serum-starved ATII cells were incubated with 100 nM insulin in the absence or presence of wortmannin (WM; 100 nM), and pAkt and total Akt were determined as described in A (n=3). (C) ATII cells were infected with a null adenovirus (Sham) or dominant-negative Akt adenovirus (DN-Akt). Na+/K+-ATPase activity, measured by 86Rb uptake, was determined in serum-starved cells with or without insulin treatment (100 nM, 30 minutes) 24 hours post-infection (n=6). Representative immunoblot of Akt expression level are shown. (D) ATII cells were infected with a null adenovirus (Sham) or constitutively active HA-tagged Akt adenovirus (CA-Akt). Na+/K+-ATPase activity was measured as described in Fig. 1B (n=6). Representative immunoblots of HA-Akt expression levels are shown. (E) ATII cells were infected with a null adenovirus (Sham) or CA-Akt. 24 hours post-infection, Na+/K+-ATPase abundance at the plasma membrane was measured as described in Fig. 1C (n=3). Representative western blots of α1-subunit abundance and Akt expression levels are shown. (F) Serum-starved ATII cells were incubated in the presence or absence of insulin (100 nM) for 30 minutes in the presence or absence of Akt 1/2 inhibitor (1 μM, 60 minutes preincubation). Na+/K+-ATPase recruitment to the plasma membrane was determined as described in Fig. 1C. A representative Na+/K+-ATPase α1 subunit immunoblot is shown. Values are expressed as mean ± s.e.m. **P<0.01. CT, control.
Fig. 4.
Fig. 4.
Role of AS160 in insulin-induced Na+/K+-ATPase recruitment to the plasma membrane. (A) A549 cells were transiently transfected with FLAG-WT-AS160; 48 hours later, the cells were serum starved and treated with 100 nM insulin for 1 or 5 minutes. Cells were lysed and AS160 was immunoprecipitated using a FLAG antibody as described in Materials and Methods. Phosphorylated AS160 (pAS160) and AS160 were determined by western blotting using pAkt-substrate (pAS) and FLAG antibodies, respectively (n=3). (B) Serum-starved A549 cell were pretreated with wortmannin (WM; 100 nM, 30 minutes) or Akt1/2 inhibitor (1 μM, 60 minutes), and then stimulated with 100 nM insulin (INS). AS160 was immunoprecipitated from cell lysates with an AS160 antibody. pAS160 and AS160 were determined by western blotting using pAS and AS160 antibodies, respectively (n=3). (C) COS-7 cells were transiently transfected with FLAG-4P-AS160; 48 hours later, cells were serum starved and treated with 100 nM insulin for 30 minutes. Na+/K+-ATPase activity and recruitment to the plasma membrane were determined as described in Fig. 1. Representative immunoblots showing Na+/K+-ATPase α1-subunit abundance and FLAG-4P-AS160 expression levels are shown (n=6). (D) COS-7 cells were transiently transfected with FLAG-WT-AS160 or FLAG-R/K-AS160; 48 hours later, cells were serum starved and treated with 100 nM insulin for 30 minutes. Na+/K+-ATPase activity and recruitment to the plasma membrane were determined as described in Fig. 1 (n=6). Representative blots showing Na+/K+-ATPase α1-subunit abundance and FLAG-AS160 expression levels are shown. Values are expressed as mean ± s.e.m. *P<0.05, **P<0.01. CT, control.
Fig. 5.
Fig. 5.
Subcellular distribution and colocalization of Rab8, Rab10 or Rab14 with Na+/K+-ATPase in alveolar epithelial cells. (A) Total membranes were isolated from GFP-Rab10 A549 cells and the membranes subfractionated on a sucrose gradient as described in Materials and Methods. Samples were collected and subjected to SDS-PAGE and immunoblot analysis using antibodies against the Na+/K+-ATPase α1 subunit, Rab8, Rab14 and GFP. In the representative experiment shown, fraction 1 is the material from the top of the gradient and fraction 8 contains the highest amount of sucrose. (B) V5-α1 A549 cells transfected with GFP-Rab8, GFP-Rab10 or EGFP-Rab14 were stained with V5 antibody as described in Materials and Methods. Representative immuofluorescence images are shown. Scale bar: 10 μm.
Fig. 6.
Fig. 6.
Rab10 is required for the translocation of Na+/K+-ATPase to the plasma membrane. (A) COS-7 cells were transiently transfected with GFP-Rab10-T23N; after 48 hours, cells were serum starved and treated with 100 nM insulin (INS) for 30 minutes. Na+/K+-ATPase recruitment to the plasma membrane was determined as described in Fig. 1C. Representative immunoblots showing Na+/K+-ATPase α1-subunit abundance and GFP-Rab10-T23N expression levels are shown (n=3). (B) COS-7 cells were transiently transfected with an empty vector (EV), GFP-WT-Rab10 (WT) or GFP-Rab10-Q68L (QL); after 48 hours, cells were serum starved and Na+/K+-ATPase recruitment to the plasma membrane was determined as described in Fig. 1C. Representative immunoblots showing Na+/K+-ATPase α1-subunit abundance, GFP and E-cadherin as a loading control are shown (n=3). (C) COS-7 cells were transiently co-transfected with FLAG-4P-AS160 plus empty vector (4P+EV) or FLAG-4P-AS160 plus GFP-Rab10-Q68L (4P+QL); after 48 hours, cells were serum starved and Na+/K+-ATPase recruitment to the plasma membrane was determined as described in Fig. 1C. Representative immunoblots showing Na+/K+-ATPase α1-subunit abundance, GFP and FLAG are shown (n=6). Values are expressed as mean ± s.e.m. *P<0.05, **P<0.01. CT, control.

Similar articles

Cited by

References

    1. Al-Khalili L., Yu M., Chibalin A. V. (2003). Na+,K+-ATPase trafficking in skeletal muscle: insulin stimulates translocation of both [alpha]1- and [alpha]2-subunit isoforms. FEBS Lett. 536, 198-202 - PubMed
    1. Babbey C. M., Ahktar N., Wang E., Chen C. C.-H., Grant B. D., Dunn K. W. (2006). Rab10 regulates membrane transport through early endosomes of polarized madin-darby canine kidney cells. Mol. Biol. Cell 17, 3156-3175 - PMC - PubMed
    1. Bellmeyer A., Martino J. M., Chandel N. S., Scott Budinger G. R., Dean D. A., Mutlu G. M. (2007). Leptin resistance protects mice from hyperoxia-induced acute lung injury. Am. J. Respir. Crit. Care Med. 175, 587-594 - PMC - PubMed
    1. Bertorello A. M., Ridge K. M., Chibalin A. V., Katz A. I., Sznajder J. I. (1999). Isoproterenol increases Na+-K+-ATPase activity by membrane insertion of alpha-subunits in lung alveolar cells. Am J. Physiol. Lung Cell Mol. Physiol. 276, L20-L27 - PubMed
    1. Bertorello A. M., Komarova Y., Smith K., Leibiger I. B., Efendiev R., Pedemonte C. H., Borisy G., Sznajder J. I. (2003). Analysis of Na+,K+-ATPase motion and incorporation into the plasma membrane in response to G protein-coupled receptor signals in living cells. Mol. Biol. Cell 14, 1149-1157 - PMC - PubMed

Publication types

MeSH terms