

Nectin-2 and N-cadherin interact through extracellular domains and induce apical accumulation of F-actin in apical constriction of Xenopus neural tube morphogenesis
- PMID: 20332149
- PMCID: PMC2847467
- DOI: 10.1242/dev.043190
Nectin-2 and N-cadherin interact through extracellular domains and induce apical accumulation of F-actin in apical constriction of Xenopus neural tube morphogenesis
Abstract
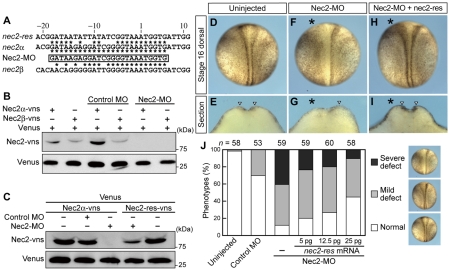
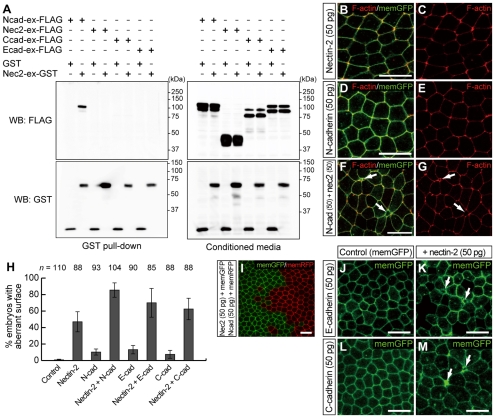
Neural tube formation is one of the most dynamic morphogenetic processes of vertebrate development. However, the molecules regulating its initiation are mostly unknown. Here, we demonstrated that nectin-2, an immunoglobulin-like cell adhesion molecule, is involved in the neurulation of Xenopus embryos in cooperation with N-cadherin. First, we found that, at the beginning of neurulation, nectin-2 was strongly expressed in the superficial cells of neuroepithelium. The knockdown of nectin-2 impaired neural fold formation by attenuating F-actin accumulation and apical constriction, a cell-shape change that is required for neural tube folding. Conversely, the overexpression of nectin-2 in non-neural ectoderm induced ectopic apical constrictions with accumulated F-actin. However, experiments with domain-deleted nectin-2 revealed that the intracellular afadin-binding motif, which links nectin-2 and F-actin, was not required for the generation of the ectopic apical constriction. Furthermore, we found that nectin-2 physically interacts with N-cadherin through extracellular domains, and they cooperatively enhanced apical constriction by driving the accumulation of F-actin at the apical cell surface. Interestingly, the accumulation of N-cadherin at the apical surface of neuroepithelium was dependent on the presence of nectin-2, but that of nectin-2 was not affected by depletion of N-cadherin. We propose a novel mechanism of neural tube morphogenesis regulated by the two types of cell adhesion molecules.
Figures


Similar articles
-
GEF-H1 functions in apical constriction and cell intercalations and is essential for vertebrate neural tube closure.J Cell Sci. 2014 Jun 1;127(Pt 11):2542-53. doi: 10.1242/jcs.146811. Epub 2014 Mar 28. J Cell Sci. 2014. PMID: 24681784 Free PMC article.
-
Formin homology 2 domain-containing 3 (Fhod3) controls neural plate morphogenesis in mouse cranial neurulation by regulating multidirectional apical constriction.J Biol Chem. 2019 Feb 22;294(8):2924-2934. doi: 10.1074/jbc.RA118.005471. Epub 2018 Dec 20. J Biol Chem. 2019. PMID: 30573686 Free PMC article.
-
Involvement of LMO7 in the association of two cell-cell adhesion molecules, nectin and E-cadherin, through afadin and alpha-actinin in epithelial cells.J Biol Chem. 2004 Jul 23;279(30):31365-73. doi: 10.1074/jbc.M401957200. Epub 2004 May 12. J Biol Chem. 2004. PMID: 15140894
-
Nectin spot: a novel type of nectin-mediated cell adhesion apparatus.Biochem J. 2016 Sep 15;473(18):2691-715. doi: 10.1042/BCJ20160235. Biochem J. 2016. PMID: 27621480 Review.
-
The immunoglobulin-like cell adhesion molecule nectin and its associated protein afadin.Annu Rev Cell Dev Biol. 2008;24:309-42. doi: 10.1146/annurev.cellbio.24.110707.175339. Annu Rev Cell Dev Biol. 2008. PMID: 18593353 Review.
Cited by
-
Global analysis of cell behavior and protein dynamics reveals region-specific roles for Shroom3 and N-cadherin during neural tube closure.Elife. 2022 Mar 4;11:e66704. doi: 10.7554/eLife.66704. Elife. 2022. PMID: 35244026 Free PMC article.
-
The non-canonical Wnt-PCP pathway shapes the mouse caudal neural plate.Development. 2018 May 8;145(9):dev157487. doi: 10.1242/dev.157487. Development. 2018. PMID: 29636380 Free PMC article.
-
Afadin controls cadherin cluster stability using clathrin-independent mechanism.Tissue Barriers. 2014 Apr 3;2:e28687. doi: 10.4161/tisb.28687. eCollection 2014. Tissue Barriers. 2014. PMID: 25045601 Free PMC article.
-
Regulation of classical cadherin membrane expression and F-actin assembly by alpha-catenins, during Xenopus embryogenesis.PLoS One. 2012;7(6):e38756. doi: 10.1371/journal.pone.0038756. Epub 2012 Jun 13. PLoS One. 2012. PMID: 22719936 Free PMC article.
-
Serum nectin-2 and nectin-4 are diagnostic in lung cancer: which is superior?Wien Klin Wochenschr. 2019 Sep;131(17-18):419-426. doi: 10.1007/s00508-019-01537-4. Epub 2019 Aug 22. Wien Klin Wochenschr. 2019. PMID: 31440821
References
-
- Barrett K., Leptin M., Settleman J. (1997). The Rho GTPase and a putative RhoGEF mediate a signaling pathway for the cell shape changes in Drosophila gastrulation. Cell 91, 905-915 - PubMed
-
- Bouchard M. J., Dong Y., McDermott B. M., Jr, Lam D. H., Brown K. R., Shelanski M., Bellve A. R., Racaniello V. R. (2000). Defects in nuclear and cytoskeletal morphology and mitochondrial localization in spermatozoa of mice lacking nectin-2, a component of cell-cell adherens junctions. Mol. Cell. Biol. 20, 2865-2873 - PMC - PubMed
-
- Burnside B. (1971). Microtubules and microfilaments in newt neuralation. Dev. Biol. 26, 416-441 - PubMed
-
- Chung H. A., Hyodo-Miura J., Nagamune T., Ueno N. (2005). FGF signal regulates gastrulation cell movements and morphology through its target NRH. Dev. Biol. 282, 95-110 - PubMed
Publication types
MeSH terms
Substances
Grants and funding
LinkOut - more resources
Full Text Sources
Research Materials
