. 2010 Apr 6;107(14):6424-9.
doi: 10.1073/pnas.0912437107. Epub 2010 Mar 23.

Hepatocyte growth factor inhibits CNS autoimmunity by inducing tolerogenic dendritic cells and CD25+Foxp3+ regulatory T cells

Affiliations

Hepatocyte growth factor inhibits CNS autoimmunity by inducing tolerogenic dendritic cells and CD25+Foxp3+ regulatory T cells

Mahdia Benkhoucha et al. Proc Natl Acad Sci U S A. .

Abstract

Immune-mediated diseases of the CNS, such as multiple sclerosis and its animal model, experimental autoimmune encephalitis (EAE), are characterized by the activation of antigen-presenting cells and the infiltration of autoreactive lymphocytes within the CNS, leading to demyelination, axonal damage, and neurological deficits. Hepatocyte growth factor (HGF) is a pleiotropic factor known for both neuronal and oligodendrocytic protective properties. Here, we assess the effect of a selective overexpression of HGF by neurons in the CNS of C57BL/6 mice carrying an HGF transgene (HGF-Tg mice). EAE induced either by immunization with myelin oligodendrocyte glycoprotein peptide or by adoptive transfer of T cells was inhibited in HGF-Tg mice. Notably, the level of inflammatory cells infiltrating the CNS decreased, except for CD25(+)Foxp3(+) regulatory T (T(reg)) cells, which increased. A strong T-helper cell type 2 cytokine bias was observed: IFN-gamma and IL-12p70 decreased in the spinal cord of HGF-Tg mice, whereas IL-4 and IL-10 increased. Antigen-specific response assays showed that HGF is a potent immunomodulatory factor that inhibits dendritic cell (DC) function along with differentiation of IL-10-producing T(reg) cells, a decrease in IL-17-producing T cells, and down-regulation of surface markers of T-cell activation. These effects were reversed fully when DC were pretreated with anti-cMet (HGF receptor) antibodies. Our results suggest that, by combining both potentially neuroprotective and immunomodulatory effects, HGF is a promising candidate for the development of new treatments for immune-mediated demyelinating diseases associated with neurodegeneration such as multiple sclerosis.


Conflict of interest statement

The authors declare no conflict of interest.

Figures

Fig. 1.
Fig. 1.
MOG(35-55)-induced EAE is inhibited in HGF-Tg mice. (A) HGF in the spinal cord of HGF-Tg mice versus WT littermates (n = 3 per group) as measured (Left) by real-time PCR (relative HGF mRNA expression) or (Center) by ELISA (ng/g of spinal cord) (mean ± SEM). *, P < 0.05. (Right) HGF measured in the serum by ELISA (ng/ml; mean ± SEM). (B) EAE scores were determined daily after disease onset in HGF-Tg mice (triangles; n = 17) and WT littermates (squares; n = 18). Shown are mean EAE score ± SEM. The difference was significant before peak disease was reached (dpi 18) and persisted until the chronic phase (dpi 45). *, P < 0.05. (C) Histopathology of paraffin-embedded spinal cord sections from PBS-perfused WT and HGF-Tg mice at peak disease (dpi 25). Sections were stained with H&E, luxol fast blue (LFB), or Bielschowsky’s silver staining (BSS) (magnification 200×). (D) Fifteen sections of spinal cord per mouse (n = 6 per group) were analyzed, and the mean number of lesions per slide (±SEM) are presented as histograms. *, P < 0.05; ***, P < 0.001. (E) Representative sections of spinal cord were analyzed. Shown are T-lymphocyte (CD4 and CD8) (red), macrophage (CD11b) (red), and DC (CD11c) (green) infiltration (magnification: 100×).
Fig. 2.
Fig. 2.
Unchanged characteristics of splenocyte populations in HGF-Tg mice during EAE. (A) Splenocytes were isolated from HGF-Tg mice and WT littermates during EAE and stained for CD4, CD8, CD11b, CD11c, and CD25-FoxP3. Bars show percentages of total splenocytes ± SEM (n = 3 per group). (B) Proliferation assay with MOG(35-55) of splenocytes from HGF-Tg mice and WT littermates (mean cpm ± SEM of triplicate experiments; n = 3). **, P < 0.01; ns, not significant. (C) Analysis by intracellular cytokine staining of the production of IFN-γ (TH1), IL-10 (TH2), and IL-17 (TH17) in splenocytes at peak dis-ease. (Left) Bars show percentages of CD4 subtypes ± SEM (n = 6 per group). (Right) Representative dot blots of IFN-γ and IL-17 analyses.
Fig. 3.
Fig. 3.
Spinal cord inflammation of HGF-Tg mice is characterized by a Th2 bias and an increase in Treg cells. (A) Inflammatory cells were isolated by Percoll gradient from pooled spinal cords of HGF-Tg (n = 6) versus WT littermates (n = 5) at EAE peak disease (dpi 25) and were stained for CD4, CD8, CD11b, and CD11c. Bars show percentages of total cells. Spinal cord inflammatory cells were stained further (B) for CD4-CD25 (histogram; percentage of total CD4+ T cells) and CD4-CD25-FoxP3 (dot blots) or (C) for IL-17. (D) Spinal cord supernatants from HGF-Tg mice and WT littermates (n = 3 per group) from a subsequent EAE were analyzed by ELISA for cytokines. Shown are the mean ± SEM of experiments performed in triplicate. *, P < 0.05; **, P < 0.01; ***, P < 0.001. (E) The increase of IL-10 detected by ELISA in the spinal cord of HGF-Tg mice at peak disease was confirmed by real-time PCR analysis. *, P < 0.05.
Fig. 4.
Fig. 4.
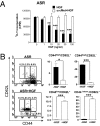
HGF inhibits in vitro CD11c+ DC function and T-cell activation markers. (A) ASR assay performed with C57BL/6 CD11c+ cells stimulated with MOG(35-55) and coincubated with TCRMOG T cells. T-cell proliferation was analyzed after CD11c+ cells were pretreated with α-cMet-blocking antibody or were left untreated and then were preincubated with increasing concentrations of rHGF. **, P < 0.01; ***, P < 0.001. (B) FACS staining for CD44 and CD62L coreceptors of CD4+ T cells after CD11c+ cells were preincubated with rHGF (30 ng/mL) or were not preincubated. Results shown are the mean of three to five independent experiments ± SEM. *, P < 0.05; ***, P < 0.001.
Fig. 5.
Fig. 5.
HGF-treated DC induce a Th2 cytokine bias and CD25+FoxP3+ Treg-dependant IL-10 production but decrease IL-17. (A) ELISA analysis of cytokines from ASR supernatant: TNF-α, IFN-γ, and IL12p70 are decreased, whereas TGF-β, IL-4, and IL-10 are increased. Results shown are mean ± SEM of triplicate experiments; rHGF added at 30 ng/mL. **, P < 0.01; ***, P < 0.001. (B) Intracellular staining of splenocytes from ASR experiments: CD4+ T-cell–dependant production of IL-17 was inhibited by rHGF-treated CD11c+ cells. Figures are representative of four independent experiments. (C) CD4+ T cells were stained for CD25-FoxP3 after CD11c+ cells were treated with rHGF (30 ng/mL) or left untreated. HGF-treated DC induce a strong increase in Treg cells. The effect of HGF on CD11c+ cells was inhibited by preincubation of CD11c+ cells with α-cMet–blocking antibody. HGF had no direct effect on CD4+ T cells, but IL-2/TGFβ–treated CD4+ T cells induced the production of CD25+FoxP3+ Treg cells (positive control). (D) IL-10 production (intracellular staining) was increased in CD25+FoxP3+ Treg cells and Vβ11(TCRMOG) CD25 T cells when T cells were cocultured with rHGF-treated CD11c+ cells. This effect was inhibited when CD11c+ cells were preincubated with α-cMet–blocking antibody. Figures are representative of four to six independent ASR experiments.
Fig. 6.
Fig. 6.
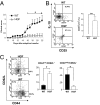
EAE induced by adoptive transfer of TCRMOG-specific (2D2) T cells is inhibited in HGF-Tg mice. Adoptive transfer of TCRMOG T cells in HGF-Tg mice (n = 10) and WT littermates (n = 12). (A) EAE was inhibited in HGF-Tg mice before peak disease was reached. Shown is the mean clinical score ± SEM at day 15 after adoptive transfer. *, P < 0.05. (B and C) Inflammatory cells infiltrating the spinal cord of HGF-Tg mice and WT littermates (n = 5 per group) at EAE peak disease (day 23 after adoptive transfer) were isolated by Percoll gradient and stained by flow cytometry. (B) (Left) Representative dot blots of CD25 and IL-10 analyses. (Right) CD25-dependent IL-10 production was increased in the spinal cord of HGF-Tg mice (mean ± SEM). **, P < 0.01. (C) Staining for CD44 and CD62L coreceptors showed that CD4+ T cells in the spinal cord of HGF-Tg mice were maintained in a low state of activation. (Left) Representative dot blots of CD62L CD44 analyses on T cells. (Right) Mean ± SEM, n = 3 per group. *, P < 0.05.

References

    1. Birchmeier C, Gherardi E. Developmental roles of HGF/SF and its receptor, the c-Met tyrosine kinase. Trends Cell Biol. 1998;8:404–410. - PubMed
    1. Nakamura T, Nawa K, Ichihara A. Partial purification and characterization of hepatocyte growth factor from serum of hepatectomized rats. Biochem Biophys Res Commun. 1984;122:1450–1459. - PubMed
    1. Nakamura T, et al. Molecular cloning and expression of human hepatocyte growth factor. Nature. 1989;342:440–443. - PubMed
    1. Stoker M, Gherardi E, Perryman M, Gray J. Scatter factor is a fibroblast-derived modulator of epithelial cell mobility. Nature. 1987;327:239–242. - PubMed
    1. Gherardi E, Gray J, Stoker M, Perryman M, Furlong R. Purification of scatter factor, a fibroblast-derived basic protein that modulates epithelial interactions and movement. Proc Natl Acad Sci USA. 1989;86:5844–5848. - PMC - PubMed

Publication types

MeSH terms

LinkOut - more resources