

Sleep disturbances, daytime sleepiness, and quality of life in adults with growth hormone deficiency
- PMID: 20332249
- PMCID: PMC2869538
- DOI: 10.1210/jc.2009-2080
Sleep disturbances, daytime sleepiness, and quality of life in adults with growth hormone deficiency
Abstract
Context: Low energy and fatigue are frequent complaints in subjects with GH deficiency (GHD). Because interrelations between sleep and GH regulation are well documented, these complaints could partly reflect alterations of sleep quality.
Objective: The objective of the study was to determine objective and subjective sleep quality and daytime sleepiness in adult GHD patients.
Subjects: Thirty patients, aged 19-74 yr, with untreated GHD (primary pituitary defects confirmed or likely in 26 patients, hypothalamic origin in four patients), and 30 healthy controls individually matched for gender, age, and body mass index participated in the study. Patients with associated pituitary deficiencies (n = 28) were on hormonal replacement therapy.
Methods: Polygraphic sleep recordings, assessment of Pittsburgh Sleep Quality Index, and Quality of Life Assessment for GHD in Adults were measured.
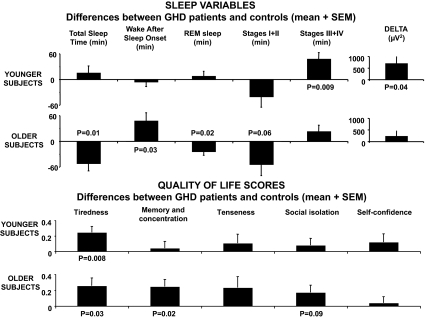
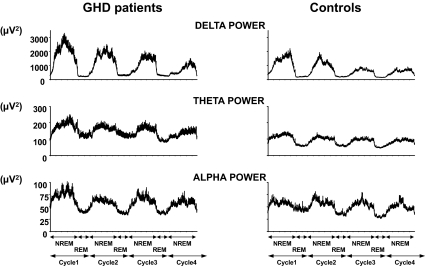
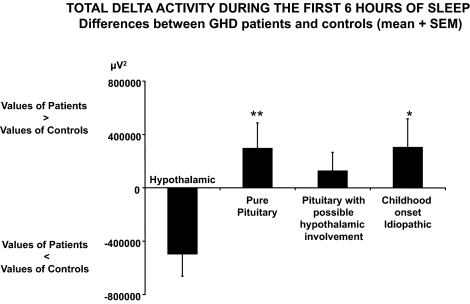
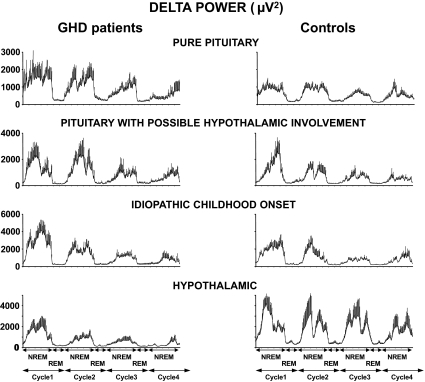
Results: Irrespective of etiology, GHD patients had a Pittsburgh Sleep Quality Index score above the clinical cutoff for poor sleep and lower Quality of Life Assessment for GHD in Adults scores than controls, with tiredness being the most affected domain. Patients with pituitary GHD spent more time in slow-wave sleep (SWS) and had a higher intensity of SWS than their controls. Among these patients, older individuals obtained less total sleep than controls, and their late sleep was more fragmented. Contrasting with pituitary GHD, the four patients with hypothalamic GHD had lower intensity of SWS than their controls.
Conclusions: GHD is associated with sleep disorders that may be caused by specific hormonal alterations as well as with poor subjective sleep quality and daytime sleepiness. Disturbed sleep is likely to be partly responsible for increased tiredness, a major component of quality of life in GHD.
Figures
Similar articles
-
Impact of GH replacement therapy on sleep in adult patients with GH deficiency of pituitary origin.Eur J Endocrinol. 2013 Apr 15;168(5):763-70. doi: 10.1530/EJE-12-1037. Print 2013 May. Eur J Endocrinol. 2013. PMID: 23447518 Free PMC article. Clinical Trial.
-
Night sleep EEG and daytime sleep propensity in adult hypopituitary patients with growth hormone deficiency before and after six months of growth hormone replacement.Psychoneuroendocrinology. 2005 Jan;30(1):29-37. doi: 10.1016/j.psyneuen.2004.05.004. Psychoneuroendocrinology. 2005. PMID: 15358440 Clinical Trial.
-
Altered sleep patterns in patients with non-functional GHRH receptor.Eur J Endocrinol. 2017 Jul;177(1):51-57. doi: 10.1530/EJE-17-0145. Epub 2017 Apr 21. Eur J Endocrinol. 2017. PMID: 28432269
-
Late onset of adrenocortical failure in GH deficiency with invisible pituitary stalk: a case report of a 48-year-old Japanese man and review of the literature.Endocr J. 2002 Apr;49(2):231-40. doi: 10.1507/endocrj.49.231. Endocr J. 2002. PMID: 12081244 Review.
-
Uncertainties in endocrine substitution therapy for central endocrine insufficiencies: growth hormone deficiency.Handb Clin Neurol. 2014;124:407-16. doi: 10.1016/B978-0-444-59602-4.00028-9. Handb Clin Neurol. 2014. PMID: 25248603 Review.
Cited by
-
Quality of life in non-functioning pituitary adenoma: A systematic review.Neurosurg Rev. 2024 Nov 23;47(1):867. doi: 10.1007/s10143-024-03126-0. Neurosurg Rev. 2024. PMID: 39578273
-
Impact of GH replacement therapy on sleep in adult patients with GH deficiency of pituitary origin.Eur J Endocrinol. 2013 Apr 15;168(5):763-70. doi: 10.1530/EJE-12-1037. Print 2013 May. Eur J Endocrinol. 2013. PMID: 23447518 Free PMC article. Clinical Trial.
-
Mechanism for the Increase in Human Growth Hormone with Administration of a Novel Test Supplement and Results Indicating Improved Physical Fitness and Sleep Efficiency.J Med Food. 2021 Jun;24(6):653-659. doi: 10.1089/jmf.2020.0109. Epub 2020 Oct 8. J Med Food. 2021. PMID: 33030391 Free PMC article. Clinical Trial.
-
Growth Hormone Deficiency and Excessive Sleepiness: A Case Report and Review of the Literature.Pediatr Endocrinol Rev. 2019 Sep;17(1):41-46. doi: 10.17458/per.vol17.2019.ge.ghdeficiencyandsleepiness. Pediatr Endocrinol Rev. 2019. PMID: 31599135 Free PMC article. Review.
-
Evidence Limitations in Determining Sexually Dimorphic Outcomes in Pediatric Post-Traumatic Hypopituitarism and the Path Forward.Front Neurol. 2020 Nov 26;11:551923. doi: 10.3389/fneur.2020.551923. eCollection 2020. Front Neurol. 2020. PMID: 33324312 Free PMC article. Review.
References
-
- Blum WF, Shavrikova EP, Edwards DJ, Rosilio M, Hartman ML, Marín F, Valle D, van der Lely AJ, Attanasio AF, Strasburger CJ, Henrich G, Herschbach P 2003 Decreased quality of life in adult patients with growth hormone deficiency compared with general populations using the new, validated, self-weighted questionnaire, questions on life satisfaction hypopituitarism module. J Clin Endocrinol Metab 88:4158–4167 - PubMed
-
- Verster JC, Pandi-Perumal, SR, Streiner, DL 2008 Sleep and quality of life in clinical medicine. Totowa, NJ: Humana Press
-
- Van Cauter E, Plat L, Copinschi G 1998 Interrelations between sleep and the somatotropic axis. Sleep 21:553–566 - PubMed
-
- Obal Jr F, Krueger JM 2004 GHRH and sleep. Sleep Med Rev 8:367–377 - PubMed
-
- Obal Jr F, Alföldi P, Cady AB, Johannsen L, Sary G, Krueger JM 1988 Growth hormone-releasing factor enhances sleep in rats and rabbits. Am J Physiol 255:R310–R316 - PubMed
Publication types
MeSH terms
Substances
Grants and funding
LinkOut - more resources
Full Text Sources
Medical
