. 2010 Apr 1;16(7):2009-21.
doi: 10.1158/1078-0432.CCR-09-2801. Epub 2010 Mar 23.

Decreased selenium-binding protein 1 in esophageal adenocarcinoma results from posttranscriptional and epigenetic regulation and affects chemosensitivity

Affiliations

Decreased selenium-binding protein 1 in esophageal adenocarcinoma results from posttranscriptional and epigenetic regulation and affects chemosensitivity

Amy L Silvers et al. Clin Cancer Res. .

Erratum in

  • Clin Cancer Res. 2012 Jun 15;18(12):3490

Abstract

Purpose: The chemopreventive effects of selenium have been extensively examined, but its role in cancer development or as a chemotherapeutic agent has only recently been explored. Because selenium-binding protein 1 (SELENBP1, SBP1, hSP56) has been shown to bind selenium covalently and selenium deficiency has been associated with esophageal adenocarcinoma (EAC), we examined its role in EAC development and its potential effect on chemosensitivity in the presence of selenium.

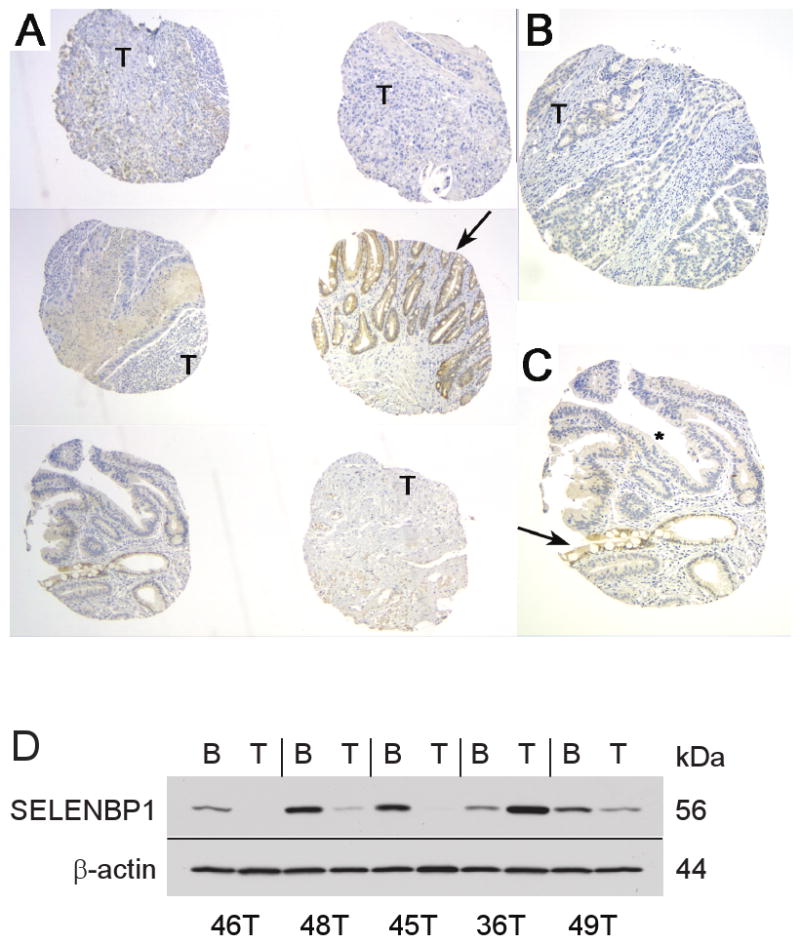
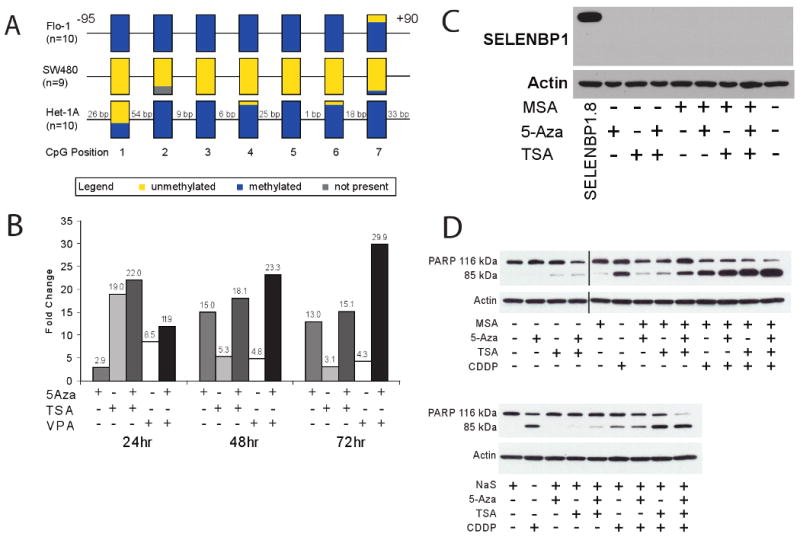
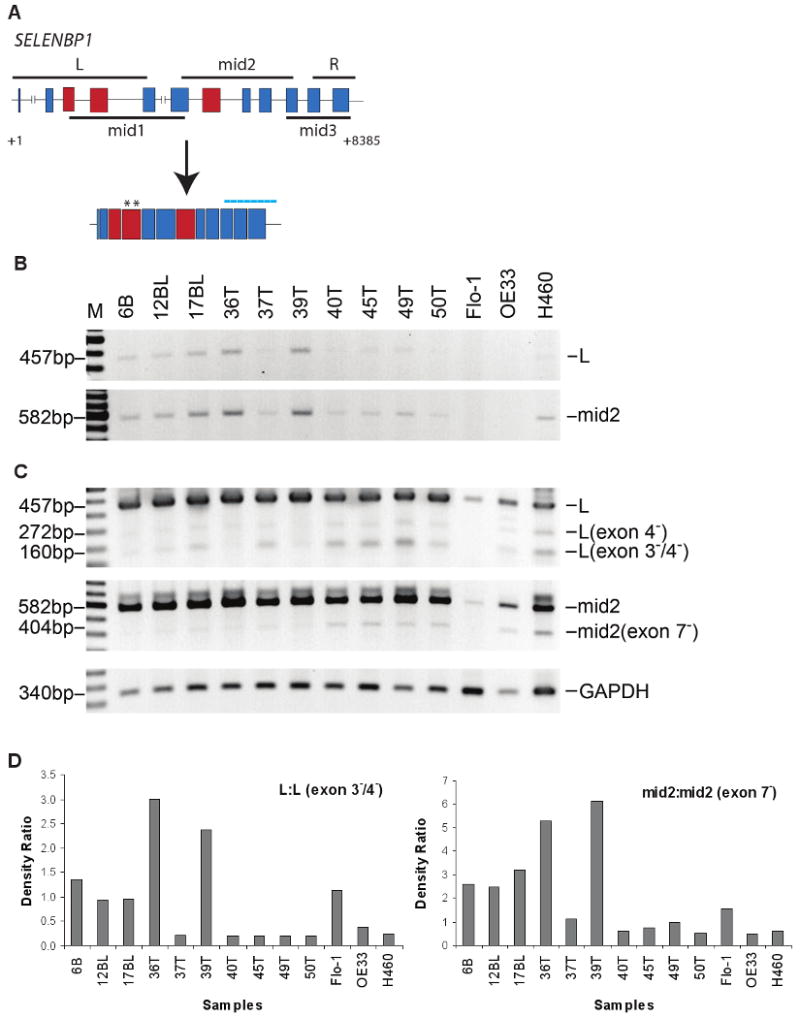
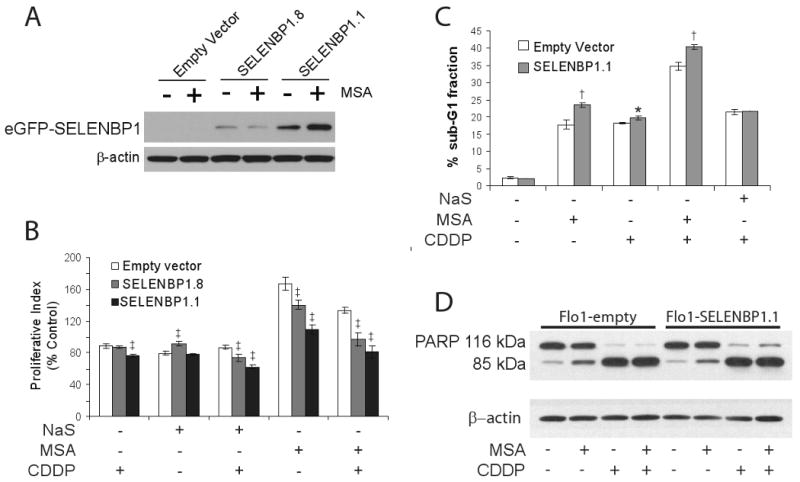
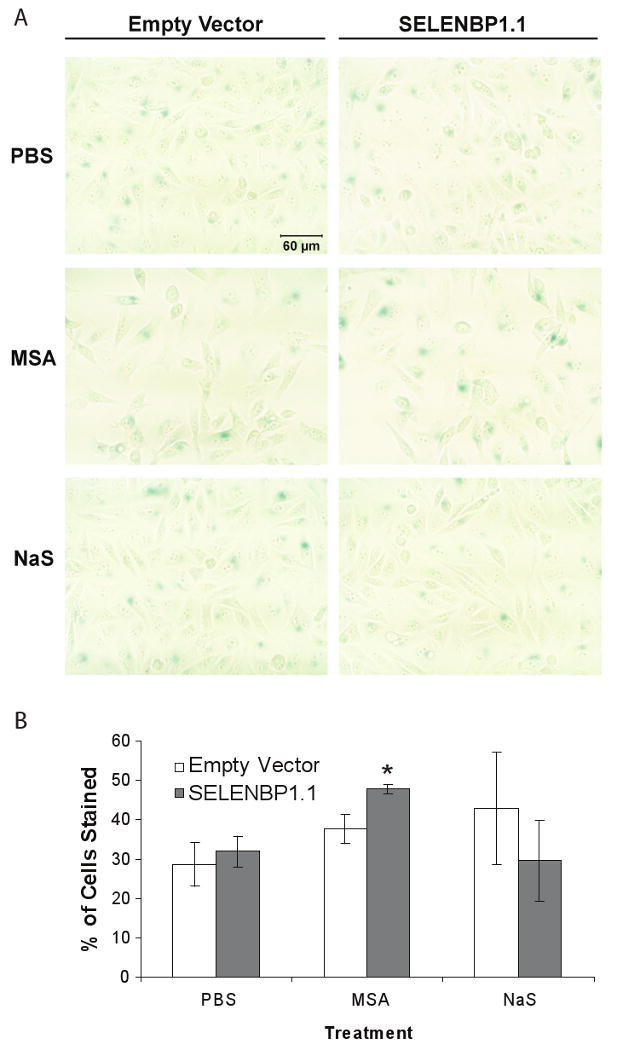
Experimental design: SELENBP1 expression level and copy number variation were determined by oligonucleotide microarrays, real-time reverse transcription-PCR, tissue microarrays, immunoblotting, and single-nucleotide polymorphism arrays. Bisulfite sequencing and sequence analysis of reverse transcription-PCR-amplified products explored epigenetic and posttranscriptional regulation of SELENBP1 expression, respectively. WST-1 cell proliferation assays, senescence-associated beta-galactosidase staining, immunoblotting, and flow cytometry were done to evaluate the biological significance of SELENBP1 overexpression in selenium-supplemented EAC cells.

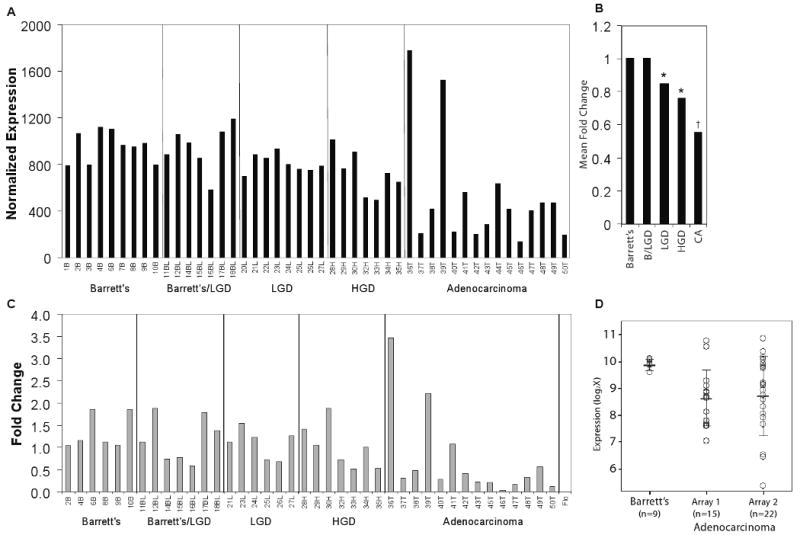
Results: SELENBP1 expression decreased significantly in Barrett's esophagus to adenocarcinoma progression. Both epigenetic and posttranscriptional mechanisms seemed to modulate SELENBP1 expression. Stable overexpression of SELENBP1 in methylseleninic acid-supplemented Flo-1 cells resulted in enhanced apoptosis, increased cellular senescence, and enhanced cisplatin cytotoxicity. Although inorganic sodium selenite similarly enhanced cisplatin cytotoxicity, these two forms of selenium elicited different cellular responses.

Conclusions: SELENBP1 expression may be an important predictor of response to chemoprevention or chemosensitization with certain forms of selenium in esophageal tissues. AACR.


Figures

Figure 1
Figure 1
SELENBP1 expression was decreased in the progression from Barrett's metaplasia to adenocarcinoma. A, Normalized relative SELENBP1 (probe set: 214433_s_at) expression as determined by HG-U133A (Affymetrix) oligonucleotide microarray analysis of primary tissue samples from patients with Barrett's metaplasia (B, n=9), Barrett's metaplasia with indeterminate or low-grade dysplasia (BL, n=7), low-grade dysplasia (L, n=8), high-grade dysplasia (H, n=7) and esophageal adenocarcinoma (T, n=15). B, Mean fold-change for each group compared to Barrett's metaplasia (*p<0.05 and †p<0.005 vs. Barrett's metaplasia). C, Quantitative real-time PCR analysis of SELENBP1 expression in a panel of primary tissue samples from the oligonucleotide microarray analysis compared to normal intestinal tissue. Relative quantitative differences were determined using the 2(-ΔΔC(T)) method. D, Comparison of SELENBP1 expression in samples of non-dysplastic Barrett's metaplasia and esophageal adenocarcinoma from 2 independent HG-133A oligonucleotide microarray analyses.
Figure 2
Figure 2
SELENBP1 expression was decreased in samples of high-grade dysplasia (*) and adenocarcinoma (T), when compared with areas of non-dysplastic Barrett's esophagus (arrows) as indicated by IHC analysis using tissue microarray (TMA) of esophageal surgical specimens from 73 patients. Representative sections from TMA for SELENBP1 expression at A, 4×, B and C, 10× magnification. D, Western immunoblotting demonstrated specific binding to SELENBP1 in patient specimens of Barrett's metaplasia (B) and esophageal adenocarcinoma (T). β-actin was used as a loading control.
Figure 3
Figure 3
A, Bisulfite sequencing of Flo-1 (EAC), SW480 (colon adenocarcinoma) and Het-1A (immortalized esophageal squamous epithelium) suggested that hypermethylation of the 5′ upstream promoter region of SELENBP1 occurs in esophageal tissues. B, Treatment of Flo-1 cells with 5 μM 5-aza-2-deoxycytidine (5-Aza), 300 nM trichostatin A (TSA) and 5 mM valproic acid (VPA) induced SELENBP1 expression compared to vehicle-treated controls, as determined by qRT-PCR. C, Treatment of Flo-1 cells with 2.5 μM methylseleninic acid (MSA), 5 μM 5-Aza, and/or 300 nM TSA did not lead to detectable levels of SELENBP1 protein. Stably-transfected SELENBP1.8 cells were used as a positive control. β-actin was used as a loading control. D, Treatment of Flo-1 cells with combinations of 2.5 μM MSA, 5 μM 5-Aza, 300 nM TSA, 10 μM sodium selenite (NaS) and/or 20 μg/mL cisplatin (CDDP) induced apoptosis, as determined by PARP cleavage.
Figure 4
Figure 4
PCR amplification and sequence analysis of the coding region of SELENBP1 suggested that full length mRNA transcripts were alternatively spliced in patient tissue samples and cell lines. A, Schematic diagram of the SELENBP1 gene. Boxes and intervening lines represent exons and introns, respectively. Solid black lines both above and below the diagram represent locations of various overlapping PCR products that were generated using the designated primer set. Darker shaded boxes represent exons that were deleted by alternative splicing. Asterisks represent the location of one set of SELENBP1 qRT-PCR primer pairs. Dotted line represents the location of the Affymetrix oligonucleotide array probe sets for SELENBP1. B, Agarose gel electrophoreses of PCR-amplified full-length L (21 cycles) and mid2 (25 cycles) products in patient tissues confirmed SELENBP1 expression levels detected by microarray and qRT-PCR analyses. C, Extended PCR amplification (35 cycles) and sequencing analyses revealed truncated products for both L (exon 4- and/or exons 3-/4-) and mid2 (exon 7-) primer pairs predominantly in patient tissues with lower levels of full-length products. Flo-1 (EAC), OE33 (EAC), and H460 (lung carcinoma) cell lines were included for comparison. B: non-dysplastic Barrett's esophageal tissue; BL: Barrett's with low-grade dysplasia; T: esophageal adenocarcinoma. PCR amplification of GAPDH (22 cycles) was used as a loading control. D, Integrated densities of electrophoresed PCR products were determined by Image J software and plotted as the density ratio of full length to alternative-splice product.
Figure 5
Figure 5
Flo-1 cells were stably-transfected with an eGFP-tagged empty vector or SELENBP1-containing plasmid. The transfection efficiency was estimated to be 60% to 70%. A, Immunoblot analysis of SELENBP1 protein expression in geneticin-selected clones in the presence or absence of 2.5 μM MSA. β-actin served as a loading control. B, Overexpression of SELENBP1 potentiated the anti-proliferative effect of MSA (2.5μM) and NaS (10 μM) particularly during treatment with CDDP (10 μg/mL) as determined by WST-1 assays. Cells were treated with either MSA or NaS for 72 hrs, and CDDP for 24 hrs. WST-1 data endpoints represent four independent wells. C, Small but statistically significant increases in apoptosis were observed by flow cytometry in SELENBP1-expressing cells treated with 2.5 μM MSA, 20 μg/mL CDDP or both agents, but were not discernible by D, immunoblot analysis of PARP cleavage. β-actin was used as a loading control. Each flow cytometry data point represents 3 independently-treated wells. All data were confirmed in repeated experiments. *, p<0.05; †, p<0.01; ‡, p<0.005; Student's t-test vs. empty vector control.
Figure 6
Figure 6
SELENBP1 enhanced MSA-induced cell senescence in Flo-1 cells. Stably-transfected Flo-1 cells were treated with 2.5 μM MSA, 10 μM NaS, or vehicle for 3 days followed by fixation and staining for senescence-associated β-galactosidase expression. A, Representative digital images of treatment groups (20× magnification) B, The number of blue-stained cells versus total cell count per image in 3 non-overlapping areas per well were recorded for each treatment group. Although variability was high, these observations were confirmed in triplicate experiments. *, p<0.05; Student's t-test vs. empty vector control.

References

    1. Jemal A, Siegel R, Ward E, et al. Cancer Statistics, 2008. CA Cancer J Clin. 2008;58:71–96. - PubMed
    1. Rudolph RE, Vaughan TL, Kristal AR, et al. Serum selenium levels in relation to markers of neoplastic progression among persons with Barrett's esophagus. J Natl Cancer Inst. 2003;95:750–7. - PMC - PubMed
    1. Fischer JL, Mihelc EM, Pollok KE, Smith ML. Chemotherapeutic selectivity conferred by selenium: a role for p53-dependent DNA repair. Mol Cancer Ther. 2007;6:355–61. - PubMed
    1. Hu H, Li Gx, Wang L, Watts J, Combs GF, Jr, Lu J. Methylseleninic acid enhances taxane drug efficacy against human prostate cancer and down-regulates antiapoptotic proteins Bcl-XL and survivin. Clin Cancer Res. 2008;14:1150–8. - PubMed
    1. Behne D, Kyriakopoulos A. Mammalian selenium-containing proteins. Annu Rev Nutr. 2001;21:453–73. - PubMed

Publication types

MeSH terms

Substances