. 2010 May 27;115(21):4237-46.
doi: 10.1182/blood-2009-11-255323. Epub 2010 Mar 23.

Akt isoforms differentially regulate neutrophil functions

Affiliations

Akt isoforms differentially regulate neutrophil functions

Jia Chen et al. Blood. .

Abstract

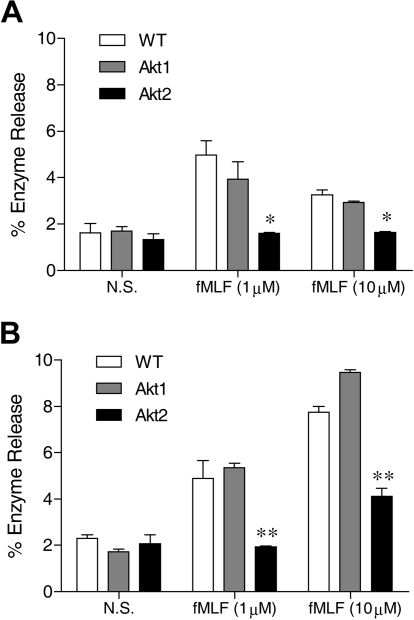
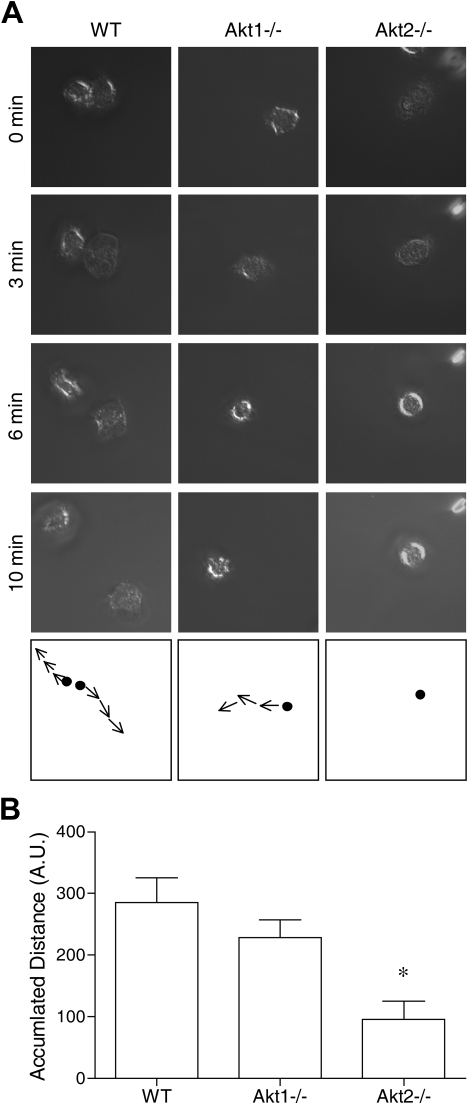
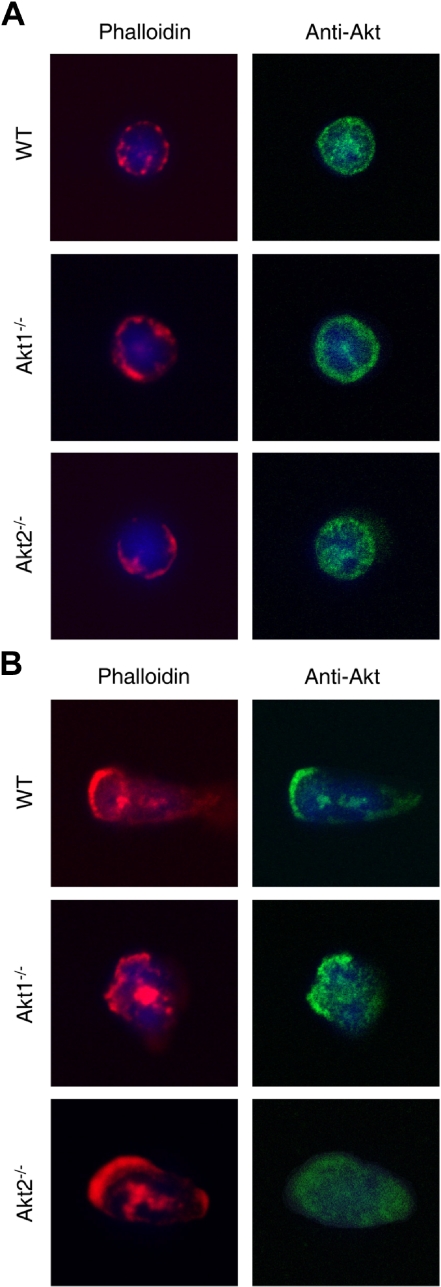
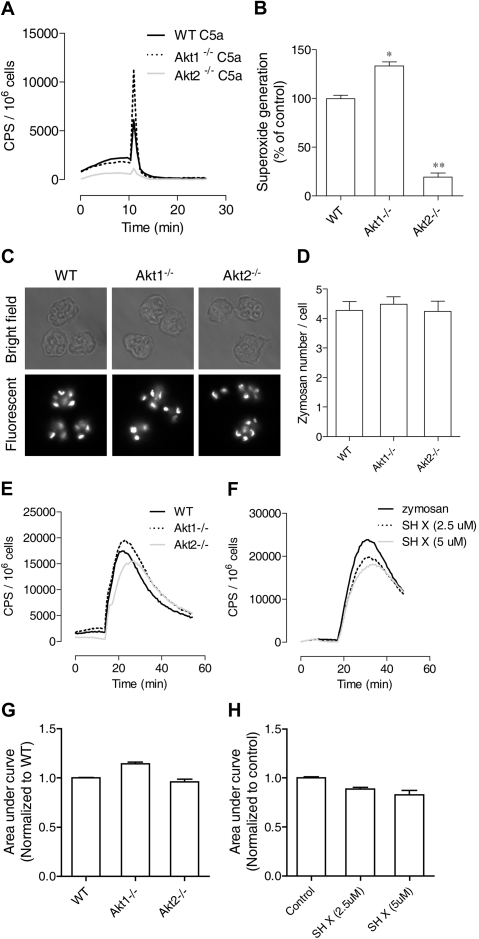
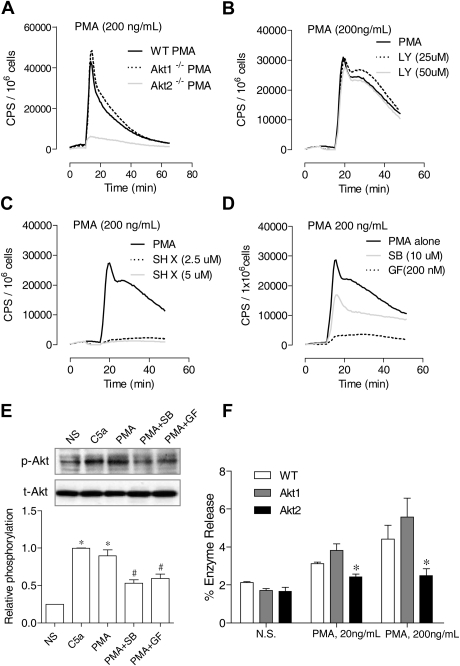
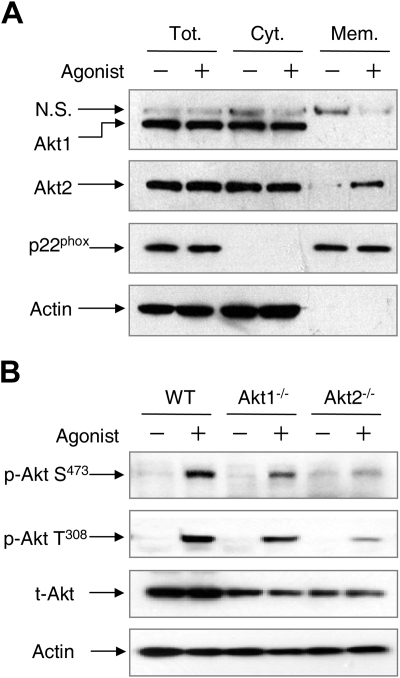
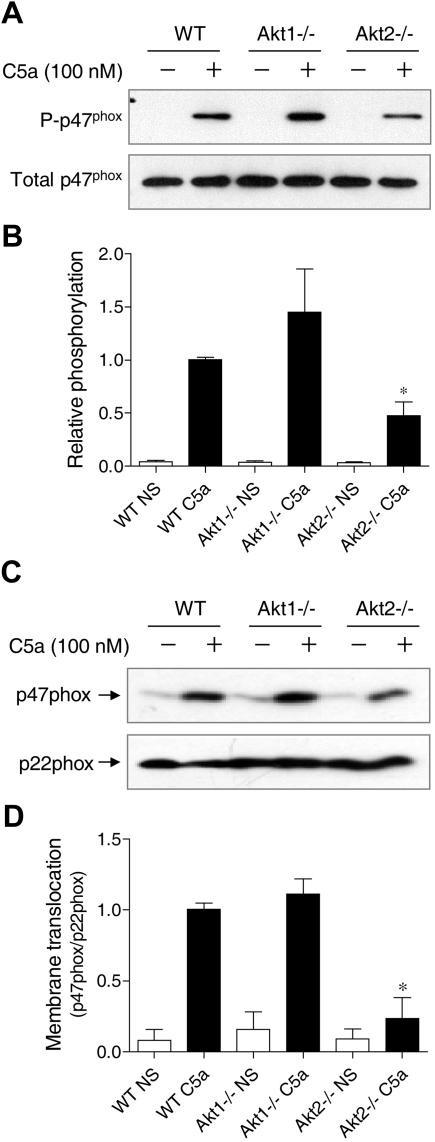
In neutrophils, the phosphoinositide 3-kinase/Akt signaling cascade is involved in migration, degranulation, and O(2)(-) production. However, it is unclear whether the Akt kinase isoforms have distinct functions in neutrophil activation. Here we report functional differences between the 2 major Akt isoforms in neutrophil activation on the basis of studies in which we used individual Akt1 and Akt2 knockout mice. Akt2(-/-) neutrophils exhibited decreased cell migration, granule enzyme release, and O(2)(-) production compared with wild-type and Akt1(-/-) neutrophils. Surprisingly, Akt2 deficiency and pharmacologic inhibition of Akt also abrogated phorbol ester-induced O(2)(-) production, which was unaffected by treatment with the phosphoinositide 3-kinase inhibitor LY294002. The decreased O(2)(-) production in Akt2(-/-) neutrophils was accompanied by reduced p47(phox) phosphorylation and its membrane translocation, suggesting that Akt2 is important for the assembly of phagocyte nicotinamide adenine dinucleotide phosphate oxidase. In wild-type neutrophils, Akt2 but not Akt1 translocated to plasma membrane upon chemoattractant stimulation and to the leading edge in polarized neutrophils. In the absence of Akt2, chemoattractant-induced Akt protein phosphorylation was significantly reduced. These results demonstrate a predominant role of Akt2 in regulating neutrophil functions and provide evidence for differential activation of the 2 Akt isoforms in neutrophils.


Figures

Figure 1
Figure 1
Akt2 is important for neutrophil release of β-glucuronidase. Bone marrow–derived neutrophils from wild-type (WT), Akt1−/−, and Akt2−/− mice were preincubated without (A) or with (B) cytochalasin B (10μM) for 15 minutes on ice and 15 minutes at 37°C. The cells were then stimulated with fMLF at indicated concentrations for 10 minutes. The released β-glucuronidase was quantified and expressed as percentage of total cellular β-glucuronidase. The results are shown as means ± SEM, on the basis of 3 independent experiments each conducted in duplicate. *P < .05, **P < .01, compared with WT in the same stimulation group.
Figure 2
Figure 2
Deficiency of Akt2 but not Akt1 impairs neutrophil migration. Bone marrow–derived neutrophils from WT, Akt1−/−, and Akt2−/− mice were seeded onto glass coverslips coated with fibrinogen and stimulated with 1μM fMLF. The migration of the neutrophils under a uniform fMLF concentration was monitored periodically, and video images were recorded. The path of cell migration over time is shown in the bottom panels. Representative images, collected from 3 independent experiments, are shown in panel A. In panel B, the distance traveled by the cells was calculated by use of the ImageJ software with manual tracking (n = 10 from each sample). *P < .05 compared with WT mouse neutrophils. Video clips for cell migration are shown in the supplemental Videos.
Figure 3
Figure 3
Redistribution of Akt2 but not Akt1 in polarized neutrophils. Bone marrow–derived neutrophils from WT, Akt1−/−, and Akt2−/− mice were seeded onto glass coverslips and incubated with buffer (A) or 1μM fMLF (B) for 2 minutes at 37°C. Stimulation was terminated when 1 mL of ice-cold PBS was added. The cells were fixed with paraformaldehyde and stained first with a pan-Akt mouse mAb and then with an Alexa Fluor 488–conjugated goat anti–mouse IgG together with rhodamine phalloidin (1:500, to stain F-actin). 4′,6-Diamidino-2-phenylindole (in mounting solution) was used for nuclear staining. Representative images shown are selected from 20 images for each experimental condition from 2 independent experiments.
Figure 4
Figure 4
Role of Akt2 in chemoattractant and particle-induced O2 generation. Neutrophils from WT, Akt1−/−, and Akt2−/− mice were stimulated with C5a (A) and O2 generation was recorded as counts per minute (CPS) on the basis of isoluminol-enhanced chemiluminescence. The traces shown are representative of 3 independent experiments. Because of the short duration of O2 production, peak values of chemiluminescence were quantified (B) and shown as percentage change (mean ± SEM) on the basis of 3 independent experiments. *P < .05, **P < .01 relative to WT neutrophils. (C) Uptake of fluorescein isothiocyanate (FITC)–labeled zymosan by bone marrow–derived neutrophils from WT, Akt1−/−, and Akt2−/− mice after a 45-minute incubation. Shown are images taken with bright field (top row) and fluorescent (bottom row, shown in black and white) microscopy. (D) The zymosan particles in 20 cells were counted and quantified, and no significant difference was seen among WT, Akt1−/−, and Akt2−/− neutrophils. Shown are mean ± SEM from 3 experiments. (E) Mouse neutrophils from WT, Akt1−/−, and Akt2−/− were stimulated with serum-opsonized, FITC-labeled zymosan (500 μg/mL), and O2 generation was recorded on the basis of luminol-enhanced chemiluminescence during the indicated time period. (F) WT neutrophils were pretreated with the Akt inhibitor X (SH X) at the indicated concentrations for 10 minutes and then stimulated with 500 μg/mL serum-opsonized, FITC-labeled zymosan. O2 generation was recorded during the time period as described previously. The traces shown in panels E and F are representative of 3 independent experiments. Quantifications of data in panels E and F are shown in panels G and H, respectively, as mean ± SEM, on the basis of 3 experiments.
Figure 5
Figure 5
Differential requirements of PI3K and Akt for PMA-induced O2 generation. (A) Neutrophils from WT, Akt1−/−, and Akt2−/− mice were stimulated with PMA (A), and O2 generation was recorded as counts per minute (CPS) on the basis of isoluminol-enhanced chemiluminescence. (B-C) WT mouse neutrophils were preincubated for 10 minutes with the PI3K inhibitor LY 294002 (B) or the Akt inhibitor SH X (C) at the indicated concentrations. The cells were then stimulated with PMA. O2 generation was recorded on the basis of isoluminol-enhanced chemiluminescence. The traces shown are representative of 2 independent experiments. (D) Neutrophils from WT mice were preincubated for 10 minutes with SB203580 (SB), GF109203x (GF), or vehicle (dimethyl sulfoxide, same concentration) and then stimulated with PMA. O2 generation was recorded on the basis of isoluminol-enhanced chemiluminescence. The traces shown are representative of 2 independent experiments. (E) The effect of SB203580 and GF109203x on PMA-induced Akt phosphorylation (top panel) was determined in neutrophils treated with the inhibitors described previously. PMA stimulation (200 ng/mL) was for 10 minutes. For comparison, neutrophils were also stimulated with C5a (100nM C5a). The relative level of Akt phosphorylation at Ser473 was determined on the basis of 3 experiments and are shown in the bar graph as mean ± SEM *P < .05 compared with the NS (no PMA or C5a stimulation) sample; #P < .05 compared with the PMA-stimulated sample. (F) Neutrophil from WT, Akt1−/−, and Akt2−/− mice were stimulated with different concentrations of PMA, and degranulation assay was performed as described in “Degranulation.” The percentage of released β-glucuronidase was determined and shown as mean ± SEM from 3 experiments, each in duplicate. *P < .05, compared to WT neutrophils.
Figure 6
Figure 6
Different cellular distribution and phosphorylation of Akt1 and Akt2. (A) WT mouse neutrophils were stimulated with 5μM fMLF (+) or buffer (−) for 2 minutes. The membrane and cytosolic fractions were separated, resolved on SDS-PAGE, and detected with specific antibodies recognizing Akt1 or Akt2. N.S. indicates a nonspecific species recognized by the anti-Akt1 antibody. Anti-p22phox and anti–β-actin antibodies were used for detection of p22phox and β-actin as markers of the membrane and cytosolic fractions, respectively. Tot indicates total (membrane plus cytosolic fractions); Cyt, cytosolic fraction; and Mem, membrane fraction. (B) Chemoattractant-induced Akt phosphorylation. WT, Akt1−/−, and Akt2−/− neutrophils (1 × 10⁷) from WT, Akt1−/−, and Akt2−/− mice were stimulated with C5a (+, 100nM) or buffer (−) for 1 minute. The samples were then resolved on SDS-PAGE and detected with specific anti–phospho-Akt antibodies recognizing phosphorylated Akt at Ser473 (Cell Signaling) and Thr308 (Calbiochem). β-actin and total Akt were detected for equal loading controls. Representative blots from 3 independent experiments are shown.
Figure 7
Figure 7
Effect of Akt gene knockout on p47phox phosphorylation and membrane translocation. (A) Neutrophils from WT, Akt1−/−, and Akt2−/− mice were stimulated for 1 minute with C5a (100nM). Total phosphoproteins were prepared by the use of antiphosphoprotein affinity chromatography as described in “Detection of p47phox phosphorylation.” The p47phox proteins in total lysate (total p47phox) and in the phosphoprotein fraction (P-p47phox) were detected by the use of an anti-p47phox antibody. The relative intensity of the Western blot bands (phosphorylated p47phox/total p47phox) was quantified and shown in panel B; *P < .05; NS, no agonist stimulation. (C) Neutrophils from WT, Akt1−/−, and Akt2−/− mice were stimulated for 1 minute with C5a (100nM). Membrane fractions were prepared, separated and resolved on SDS-PAGE, and detected with specific antibodies recognizing p47phox and p22phox (a membrane protein used as membrane marker for loading control). Western blot bands (p47phox/p22phox) was quantified and shown in panel D. *P < .05; NS, no agonist stimulation.

References

    1. Jones PF, Jakubowicz T, Pitossi FJ, Maurer F, Hemmings BA. Molecular cloning and identification of a serine/threonine protein kinase of the second-messenger subfamily. Proc Natl Acad Sci U S A. 1991;88(10):4171–4175. - PMC - PubMed
    1. Cheng JQ, Godwin AK, Bellacosa A, et al. AKT2, a putative oncogene encoding a member of a subfamily of protein-serine/threonine kinases, is amplified in human ovarian carcinomas. Proc Natl Acad Sci U S A. 1992;89(19):9267–9271. - PMC - PubMed
    1. Konishi H, Kuroda S, Tanaka M, et al. Molecular cloning and characterization of a new member of the RAC protein kinase family: association of the pleckstrin homology domain of three types of RAC protein kinase with protein kinase C subspecies and beta gamma subunits of G proteins. Biochem Biophys Res Commun. 1995;216(2):526–534. - PubMed
    1. Walker KS, Deak M, Paterson A, Hudson K, Cohen P, Alessi DR. Activation of protein kinase B beta and gamma isoforms by insulin in vivo and by 3-phosphoinositide-dependent protein kinase-1 in vitro: comparison with protein kinase B alpha. Biochem J. 1998;331(Pt 1):299–308. - PMC - PubMed
    1. Irie HY, Pearline RV, Grueneberg D, et al. Distinct roles of Akt1 and Akt2 in regulating cell migration and epithelial-mesenchymal transition. J Cell Biol. 2005;171(6):1023–1034. - PMC - PubMed

Publication types

MeSH terms