. 2010 Apr;7(2):26009.
doi: 10.1088/1741-2560/7/2/026009. Epub 2010 Mar 23.

Local glutamate release in the rat ventral lateral thalamus evoked by high-frequency stimulation

Affiliations

Local glutamate release in the rat ventral lateral thalamus evoked by high-frequency stimulation

Filippo Agnesi et al. J Neural Eng. 2010 Apr.

Abstract

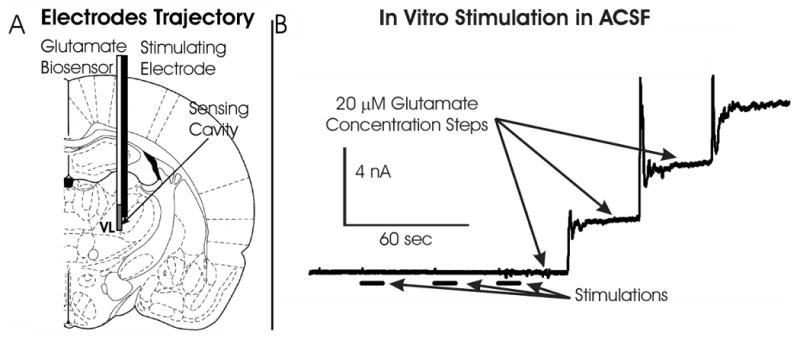
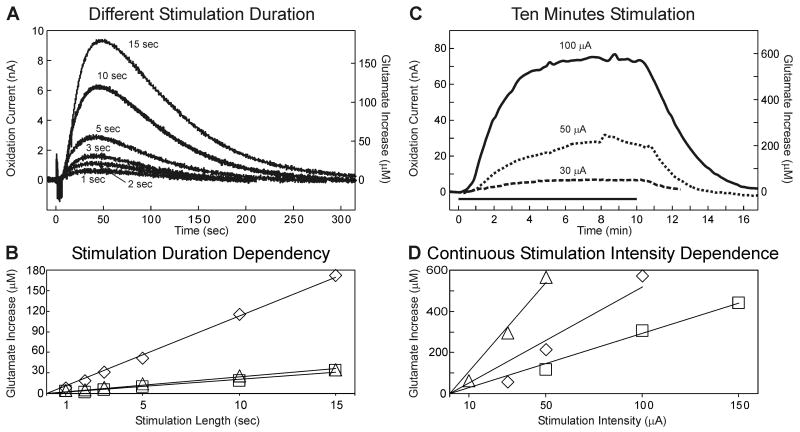
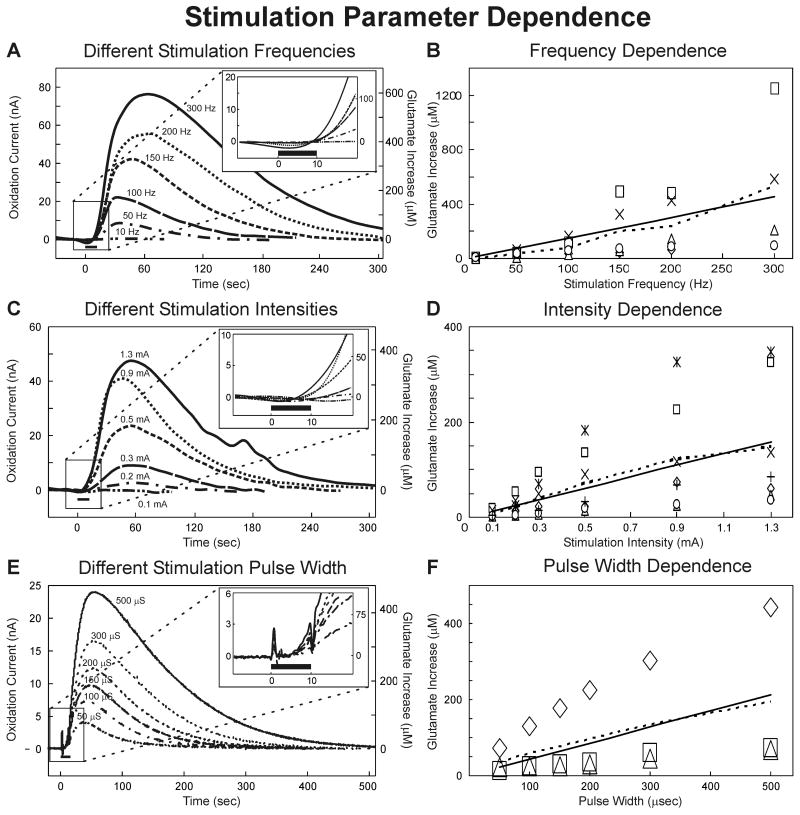
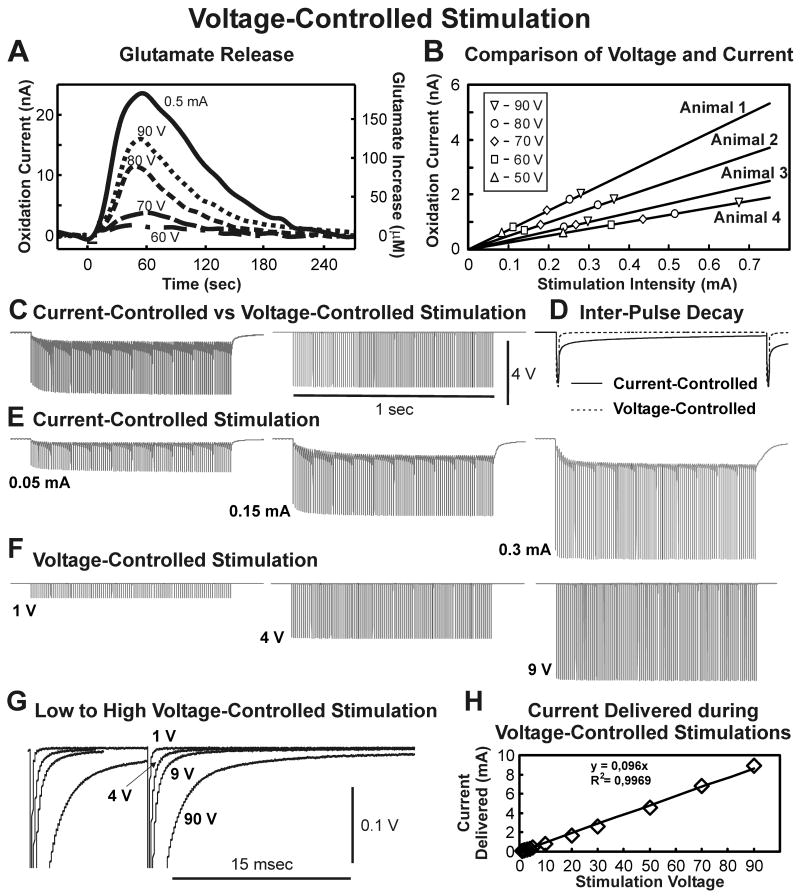
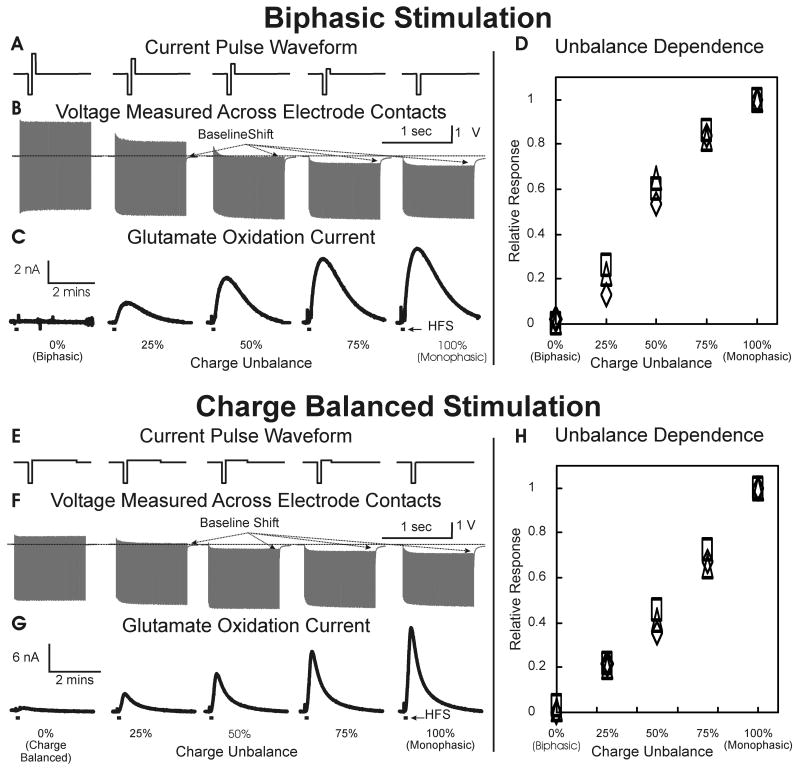
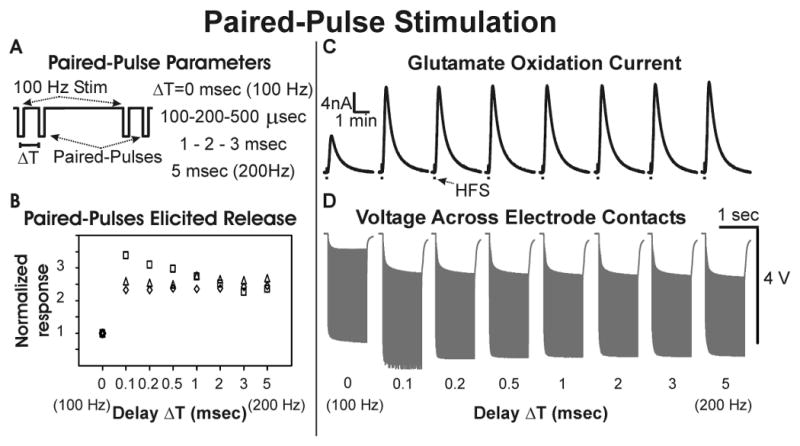
Thalamic deep brain stimulation (DBS) is proven therapy for essential tremor, Parkinson's disease and Tourette's syndrome. We tested the hypothesis that high-frequency electrical stimulation results in local thalamic glutamate release. Enzyme-linked glutamate amperometric biosensors were implanted in anesthetized rat thalamus adjacent to the stimulating electrode. Electrical stimulation was delivered to investigate the effect of frequency, pulse width, voltage-controlled or current-controlled stimulation, and charge balancing. Monophasic electrical stimulation-induced glutamate release was linearly dependent on stimulation frequency, intensity and pulse width. Prolonged stimulation evoked glutamate release to a plateau that subsequently decayed back to baseline after stimulation. Glutamate release was less pronounced with voltage-controlled stimulation and not present with charge balanced current-controlled stimulation. Using fixed potential amperometry in combination with a glutamate bioprobe and adjacent microstimulating electrode, the present study has shown that monophasic current-controlled stimulation of the thalamus in the anesthetized rat evoked linear increases in local extracellular glutamate concentrations that were dependent on stimulation duration, frequency, intensity and pulse width. However, the efficacy of monophasic voltage-controlled stimulation, in terms of evoking glutamate release in the thalamus, was substantially lower compared to monophasic current-controlled stimulation and entirely absent with biphasic (charge balanced) current-controlled stimulation. It remains to be determined whether similar glutamate release occurs with human DBS electrodes and similar charge balanced stimulation. As such, the present results indicate the importance of evaluating local neurotransmitter dynamics in studying the mechanism of action of DBS.


Figures

Figure 1
Figure 1
(A):Illustration showing the configuration of the electrical bipolar stimulating electrode and glutamate biosensor implanted in the rat thalamus to evoke and record glutamate release, respectively. (B): Oxidation current measured by the glutamate biosensor in artificial cerebrospinal fluid during 10 seconds monophasic stimulations (1 mA, 100 Hz, 100 μsec pulse width) and after 20 μM step increases in glutamate concentration.
Figure 2
Figure 2
Stimulation Duration Dependency. (A): Evoked glutamate release in the thalamus of one rat at different monophasic stimulation durations (current intensity and pulse width held constant: 0.2 mA, 100 Hz, 100 μs). (B): Peak magnitudes in thalamic glutamate extracellular concentrations obtained at varying monophasic stimulation durations (n=3 rats). Different symbols represent measurements obtained from separate animals. Black lines represent best fit for a given animal. (C): Thalamic glutamate release obtained from one rat during 10 min of monophasic stimulation at a fixed frequency and pulse width (100 Hz, 100 μsec). The black line above the x-axis represents the 10 min period of stimulation. (D): Peak magnitudes of thalamic glutamate extracellular concentrations obtained with 10 min monophasic stimulation (100 Hz, 100 μsec) and varying stimulation intensity in three rats. Different symbols represent measurements obtained from separate animals. Black lines represent best fit for a given animal.
Figure 3
Figure 3
Stimulation Parameter Dependence. (A): Evoked glutamate release in the thalamus of one rat at different monophasic stimulation frequencies (10-300 Hz) with current intensity and pulse width held constant (0.5 mA, 100 μsec). The inset shows the initial phase of the response around the 10 sec (black bar) stimulation period. (B): Peak magnitudes in thalamic glutamate extracellular concentrations elicited at each test stimulation frequency (n=5 rats). The dashed line is the average and solid line the linear regression (r2 =0.907). (C): Evoked glutamate release in the thalamus of one rat at different monophasic stimulation intensities (0.1-1.3 mA) with frequency and pulse width held constant (100 Hz and 100 μsec). The inset shows the initial phase of the response around the 10 sec (black bar) stimulation period. (D): Peak magnitudes in thalamic glutamate extracellular concentrations elicited at each test stimulation current intensity (n=7 rats). The dashed line is the average and solid line the linear regression (r2 =0.97). (E) Evoked glutamate release in the thalamus of one rat at different monophasic stimulation pulse widths (50-500 μsec) with frequency and current intensity held constant (100 Hz, 0.2 mA). The inset shows the initial phase of the response around the 10 sec (black bar) stimulation period. (F) Peak magnitudes in thalamic glutamate extracellular concentrations elicited at each test stimulation pulse width (n=3 rats).
Figure 4
Figure 4
Voltage-controlled Stimulation. (A): Glutamate release in the thalamus in one rat evoked by monophasic voltage-controlled stimulation (60-90 V) compared to 0.5 mA current-controlled stimulation with stimulation frequency and pulse width held constant (100 Hz, 0.5 msec). (B): Comparison of current-controlled and voltage stimulations. Each line represents the linear regression of peak glutamate extracellular concentrations attained with 10 seconds of current-controlled stimulations for four rats. Symbols correspond to peak glutamate extracellular concentrations obtained in these animals. (C): Comparison of stimulation voltages measured across electrode contact during 0.1 mA current-controlled stimulation (left) and a comparable 4V voltage-controlled stimulation (right). (D): The first pulse of both stimulations showing differences in the interpulse decay for current-controlled (solid line) and voltage-controlled (dashed line) stimulations. (E): Voltages measured across electrode contacts during current-controlled stimulations with increasing current intensities (0.05-0.3 mA). (F): Voltages measured across electrode contacts during voltage-controlled stimulations of increasing voltage intensities (1-9 V). (G): Overlap of the last pulse of 1 sec long stimulation train delivered with voltage-controlled stimulation showing the interpulse decay is minimal with respect to a relatively higher stimulation voltage of 90 V. (H): Peak current measured at different applied voltage-controlled stimulations (1-90 V).
Figure 5
Figure 5
Biphasic to Monophasic Stimulation. (A): Current pulse waveform delivered during current-controlled biphasic stimulation from biphasic (left) to monophasic (right). (B): Voltage measured across electrode contacts showing progressive deviation from baseline with increasing charge unbalance. (C): Thalamic glutamate release measured during 10 sec (0.2 mA, 100 Hz, 100 μs pulse width), progressively unbalanced, stimulations shown in (A). (D): Peak glutamate responses elicited by progressively unbalanced biphasic stimulations relative to the peak glutamate response (set at 1) obtained from monophasic stimulation (n=3 rats). (E): Current pulse waveform delivered during current-controlled charge balanced stimulation from balanced (left) to monophasic (right). (F): Voltage measured across electrode contacts showing progressive deviation from baseline with increasing charge unbalance. (G): Thalamic glutamate release measured during 10 sec (0.2 mA, 100 Hz, 100 μs cathodic and 0-1ms anodic pulse width), progressively charge unbalanced stimulations as shown in (E). (H): Peak glutamate response elicited by progressively unbalanced biphasic stimulations relative to the peak glutamate response (set at 1) obtained from monophasic stimulation (n=3 rats). Black bar below each evoked response corresponds to the period of high frequency stimulation (HFS).
Figure 6
Figure 6
Paired-Pulse Stimulation. (A): Schematic representation of paired-pulse stimulation with a 100 Hz stimulation interleaved with paired pulses at an interpulse delay of ΔT (0.1-5 msec). (B): Peak thalamic glutamate response elicited with different interpulse delays relative to the the peak glutamate response (set at 1) obtained with 100 Hz stimulations at ΔT=0 (n=3 rats). (C): Thalamic glutamate release elicited at different interpulse delays in one rat (0.1 mA, 100 μs pulse width). (D): Voltage measured across electrode contacts during paired-pulse stimulations.

References

    1. Hodaie M, Wennberg RA, Dostrovsky JO, Lozano AM. Chronic anterior thalamus stimulation for intractable epilepsy. Epilepsia. 2002;43:603–608. - PubMed
    1. Benabid AL, Pollak P, Gao D, Hoffmann D, Limousin P, Gay E. Chronic electrical stimulation of the ventralis intermedius nucleus of the thalamus as a treatment of movement disorders. J Neurosurg. 1996;84:203–214. - PubMed
    1. Koller WC, Pahwa PR, Lyons KE, Wilkinson SB. Deep brain stimulation of the Vim nucleus of the thalamus for the treatment of tremor. Neurology. 2000;55:S29–33. - PubMed
    1. Lozano AM. Vim thalamic stimulation for tremor. Arch Med Res. 2000;31:266–269. - PubMed
    1. Hariz GM, Lindberg M, Bergenheim AT. Impact of thalamic deep brain stimulation on disability and health-related quality of life in patients with essential tremor. J Neurol Neurosurg Psychiatry. 2002;72:47–52. - PMC - PubMed

Publication types